\n
## Diagram: Adaptive Retrieval and Classification Pipeline
### Overview
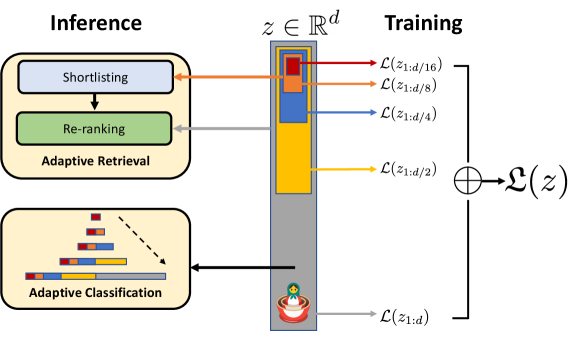
This diagram illustrates a pipeline for adaptive retrieval and classification, showing the processes involved in both training and inference stages. The diagram depicts a vertical structure representing a dimensionality reduction or encoding process, with inference and training occurring on either side.
### Components/Axes
The diagram is divided into three main sections:
* **Inference (Left):** Contains two stages: Shortlisting and Re-ranking, leading to Adaptive Retrieval and Adaptive Classification.
* **Central Structure:** A vertical gray rectangle with colored segments representing different levels of dimensionality reduction.
* **Training (Right):** Shows the summation of the encoded representations.
Key labels include:
* `z ∈ ℝᵈ` : Represents the input vector in d-dimensional space.
* `L(z₁:d/16)`, `L(z₁:d/8)`, `L(z₁:d/4)`, `L(z₁:d/2)`, `L(z₁:d)`: Labels indicating different levels of encoded representations.
* `⊕ – Σ(z)`: Represents the summation of encoded representations during training.
* Adaptive Retrieval
* Adaptive Classification
### Detailed Analysis or Content Details
The central structure is a vertical gray rectangle divided into five colored segments from top to bottom: red, blue, yellow, orange, and a red/white patterned base. Each segment is associated with a level of encoded representation `L(z)` with decreasing dimensionality.
* **Red Segment (Top):** Labeled `L(z₁:d/16)`. An orange arrow connects this segment to the "Shortlisting" stage in the Inference section.
* **Blue Segment:** Labeled `L(z₁:d/8)`. An orange arrow connects this segment to the "Re-ranking" stage in the Inference section.
* **Yellow Segment:** Labeled `L(z₁:d/4)`. An orange arrow connects this segment to the "Adaptive Retrieval" stage in the Inference section.
* **Orange Segment:** Labeled `L(z₁:d/2)`. An orange arrow connects this segment to the "Adaptive Classification" stage in the Inference section.
* **Red/White Patterned Segment (Bottom):** Labeled `L(z₁:d)`. An orange arrow connects this segment to the summation symbol `⊕ – Σ(z)` in the Training section.
The Inference section shows a flow from "Shortlisting" to "Re-ranking", then to "Adaptive Retrieval" and "Adaptive Classification". A dashed arrow connects "Adaptive Retrieval" to "Adaptive Classification".
The Training section shows the summation symbol `⊕ – Σ(z)` connected to all the encoded representations via a bracket.
### Key Observations
The diagram highlights a hierarchical encoding process where the input vector `z` is progressively reduced in dimensionality through the layers `L(z)`. The different levels of encoded representations are used for different stages of inference (shortlisting, re-ranking, retrieval, classification). The training process involves summing these encoded representations.
### Interpretation
This diagram represents a machine learning pipeline, likely for information retrieval or classification tasks. The central structure suggests an autoencoder or similar dimensionality reduction technique. The different levels of encoded representations (`L(z)`) likely capture different levels of abstraction or granularity of the input data.
* **Inference:** The inference process uses these encoded representations to first narrow down the search space (shortlisting), then refine the results (re-ranking), and finally retrieve and classify the relevant information.
* **Training:** The training process aims to learn the optimal encoding by minimizing the reconstruction error (summing the encoded representations).
The use of adaptive retrieval and classification suggests that the system can dynamically adjust its retrieval and classification strategies based on the input data. The diagram doesn't provide specific details about the algorithms used, but it provides a high-level overview of the pipeline's architecture. The diagram is conceptual and does not contain numerical data.