## Line Chart: PESQ vs Bitrate (bps)
### Overview
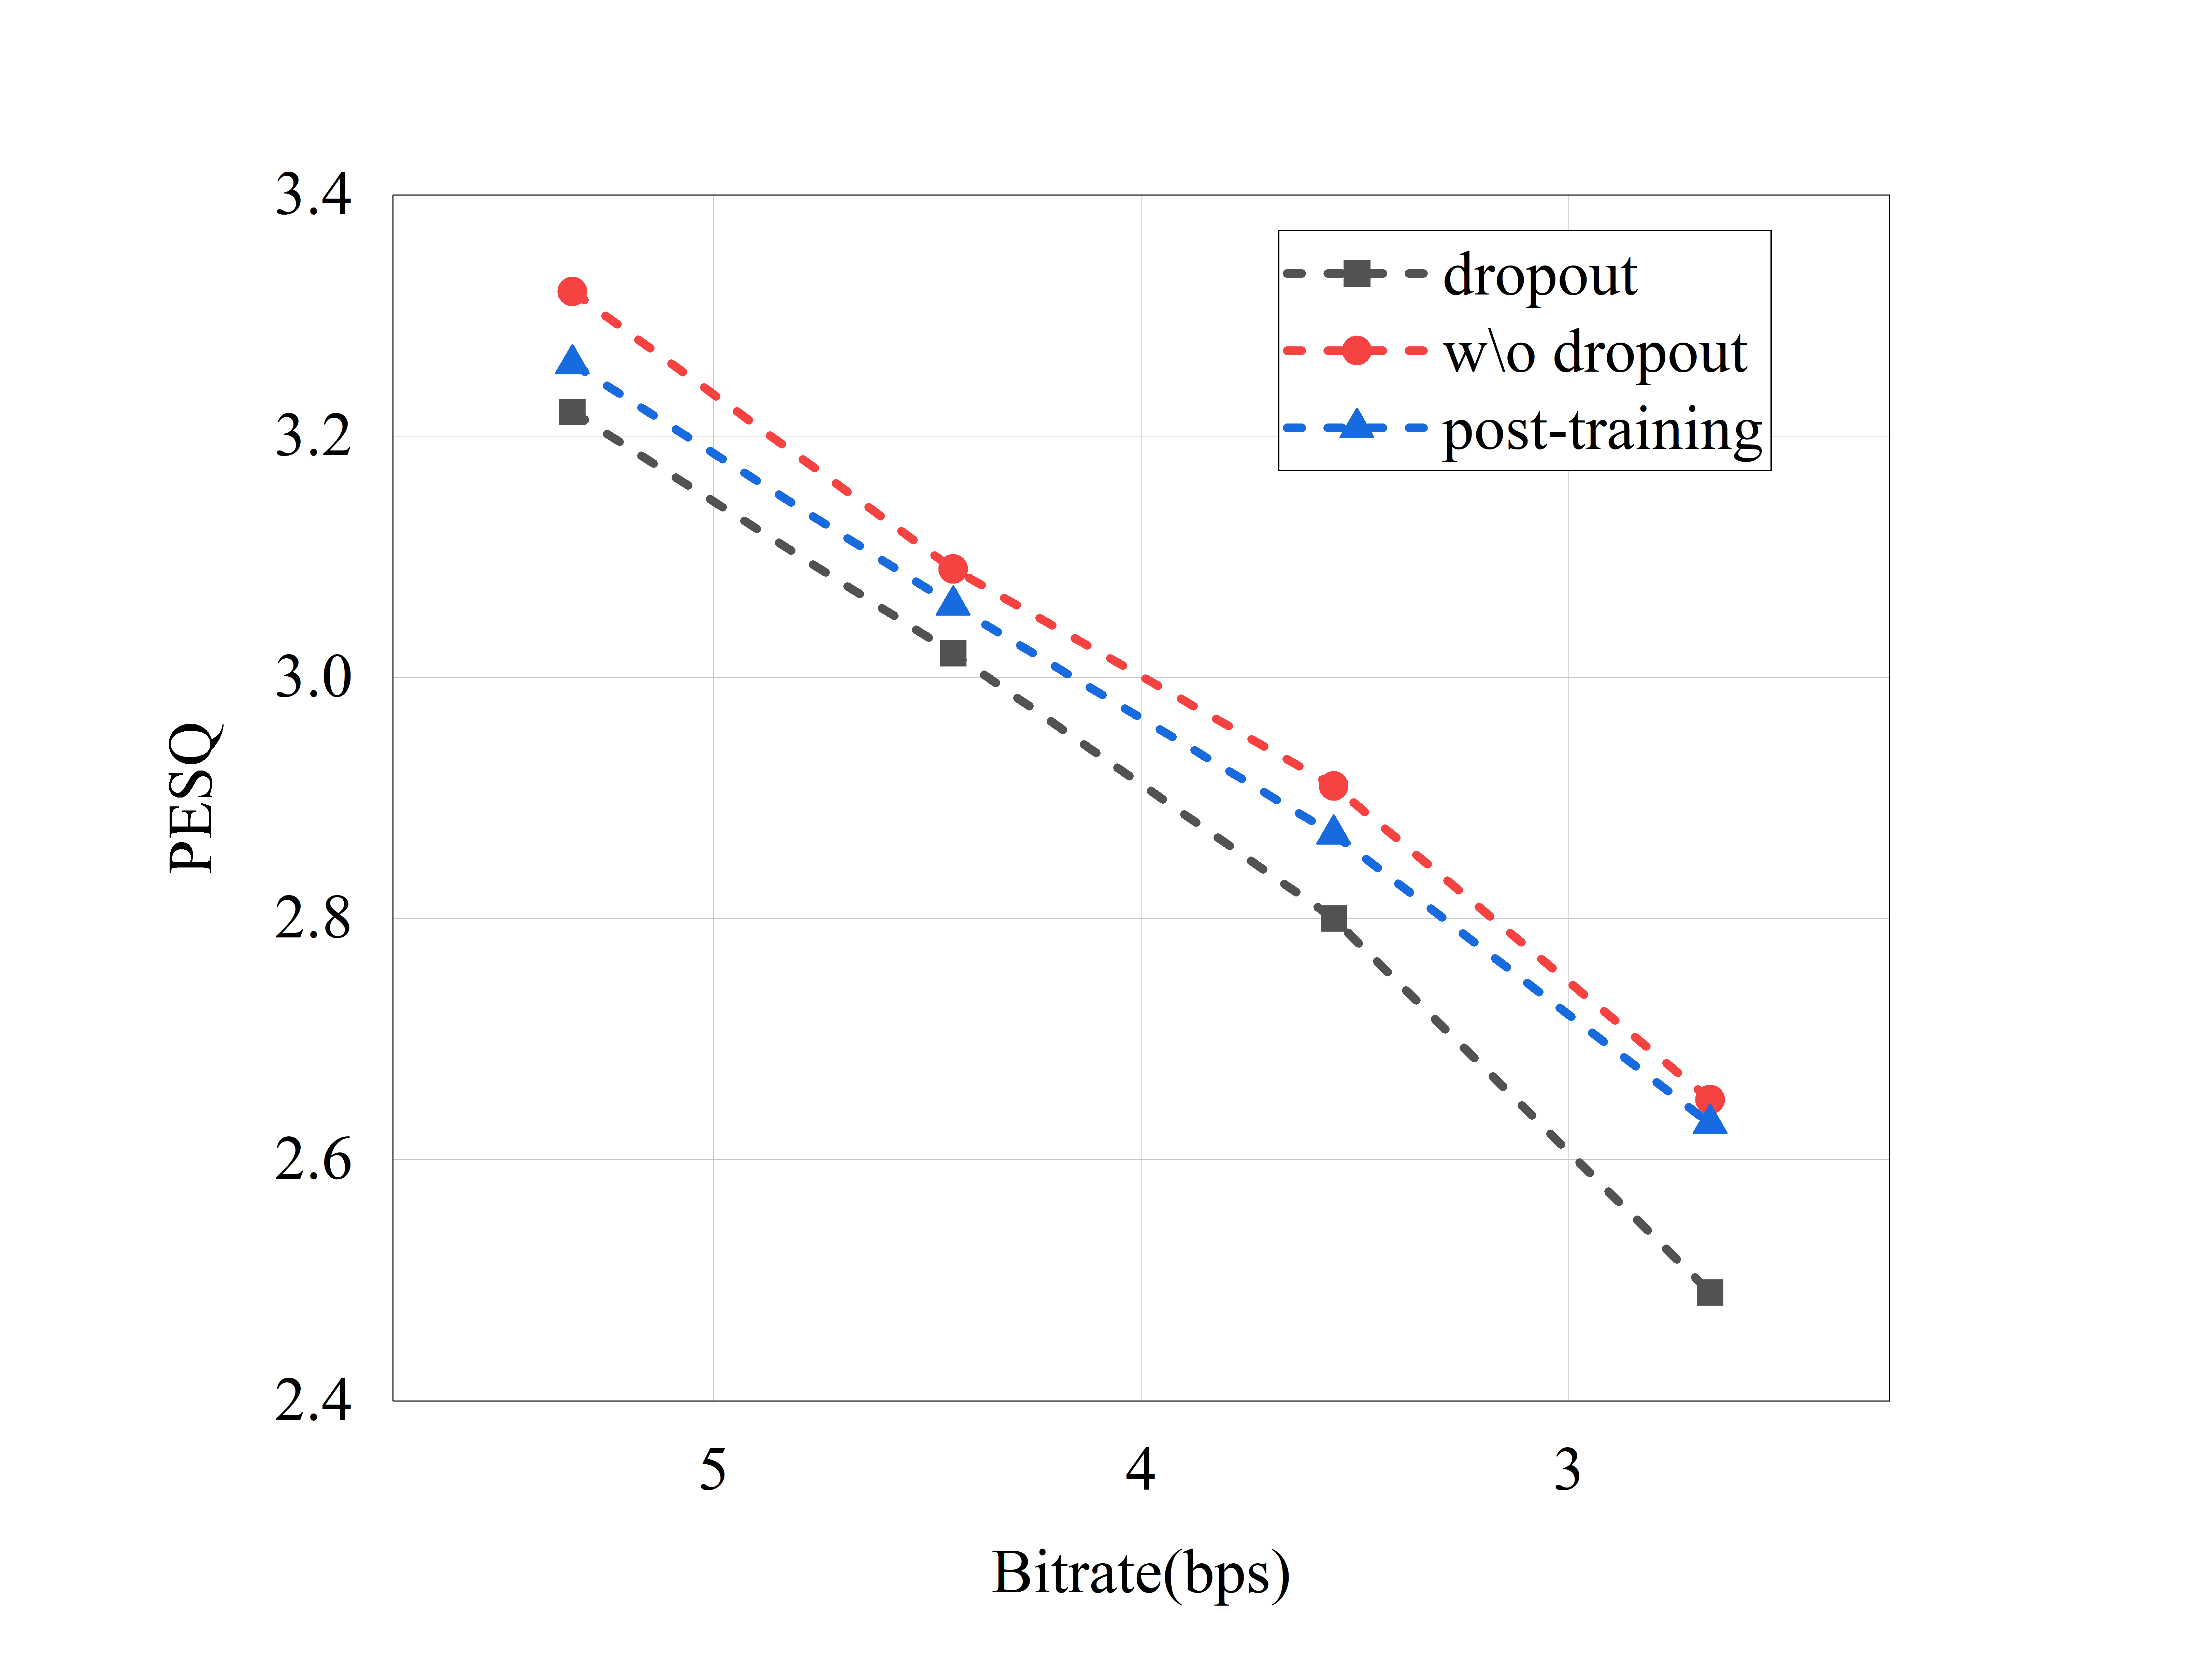
The chart compares three methods (dropout, w/o dropout, post-training) across bitrates (3-5 bps) using the PESQ metric. All three methods show decreasing PESQ scores as bitrate decreases, with post-training consistently outperforming the others.
### Components/Axes
- **Y-axis**: PESQ (2.4–3.4)
- **X-axis**: Bitrate (bps) (3–5)
- **Legend**: Top-right corner with three entries:
- Black dashed line + squares: dropout
- Red dashed line + circles: w/o dropout
- Blue dashed line + triangles: post-training
### Detailed Analysis
1. **Dropout (Black)**:
- At 5 bps: ~3.25 PESQ
- At 4 bps: ~3.0 PESQ
- At 3 bps: ~2.5 PESQ
- Trend: Steepest decline, dropping 0.75 PESQ across bitrates.
2. **w/o Dropout (Red)**:
- At 5 bps: ~3.3 PESQ
- At 4 bps: ~3.1 PESQ
- At 3 bps: ~2.65 PESQ
- Trend: Gradual decline, dropping 0.65 PESQ across bitrates.
3. **Post-Training (Blue)**:
- At 5 bps: ~3.2 PESQ
- At 4 bps: ~3.05 PESQ
- At 3 bps: ~2.6 PESQ
- Trend: Moderate decline, dropping 0.6 PESQ across bitrates.
### Key Observations
- Post-training maintains the highest PESQ scores at all bitrates.
- Dropout method shows the most significant performance degradation as bitrate decreases.
- w/o dropout performs better than dropout but worse than post-training.
### Interpretation
The data suggests that **post-training** is the most effective method for preserving audio quality (as measured by PESQ) across varying bitrates. The dropout technique appears to introduce the greatest performance penalty, likely due to its inherent noise-reduction mechanism. The w/o dropout baseline demonstrates that removing dropout improves performance but does not match post-training's effectiveness. This implies that post-training optimizes the model's ability to handle low-bitrate audio without sacrificing quality, making it ideal for bandwidth-constrained applications.