## Heatmap: Layer vs Token
### Overview
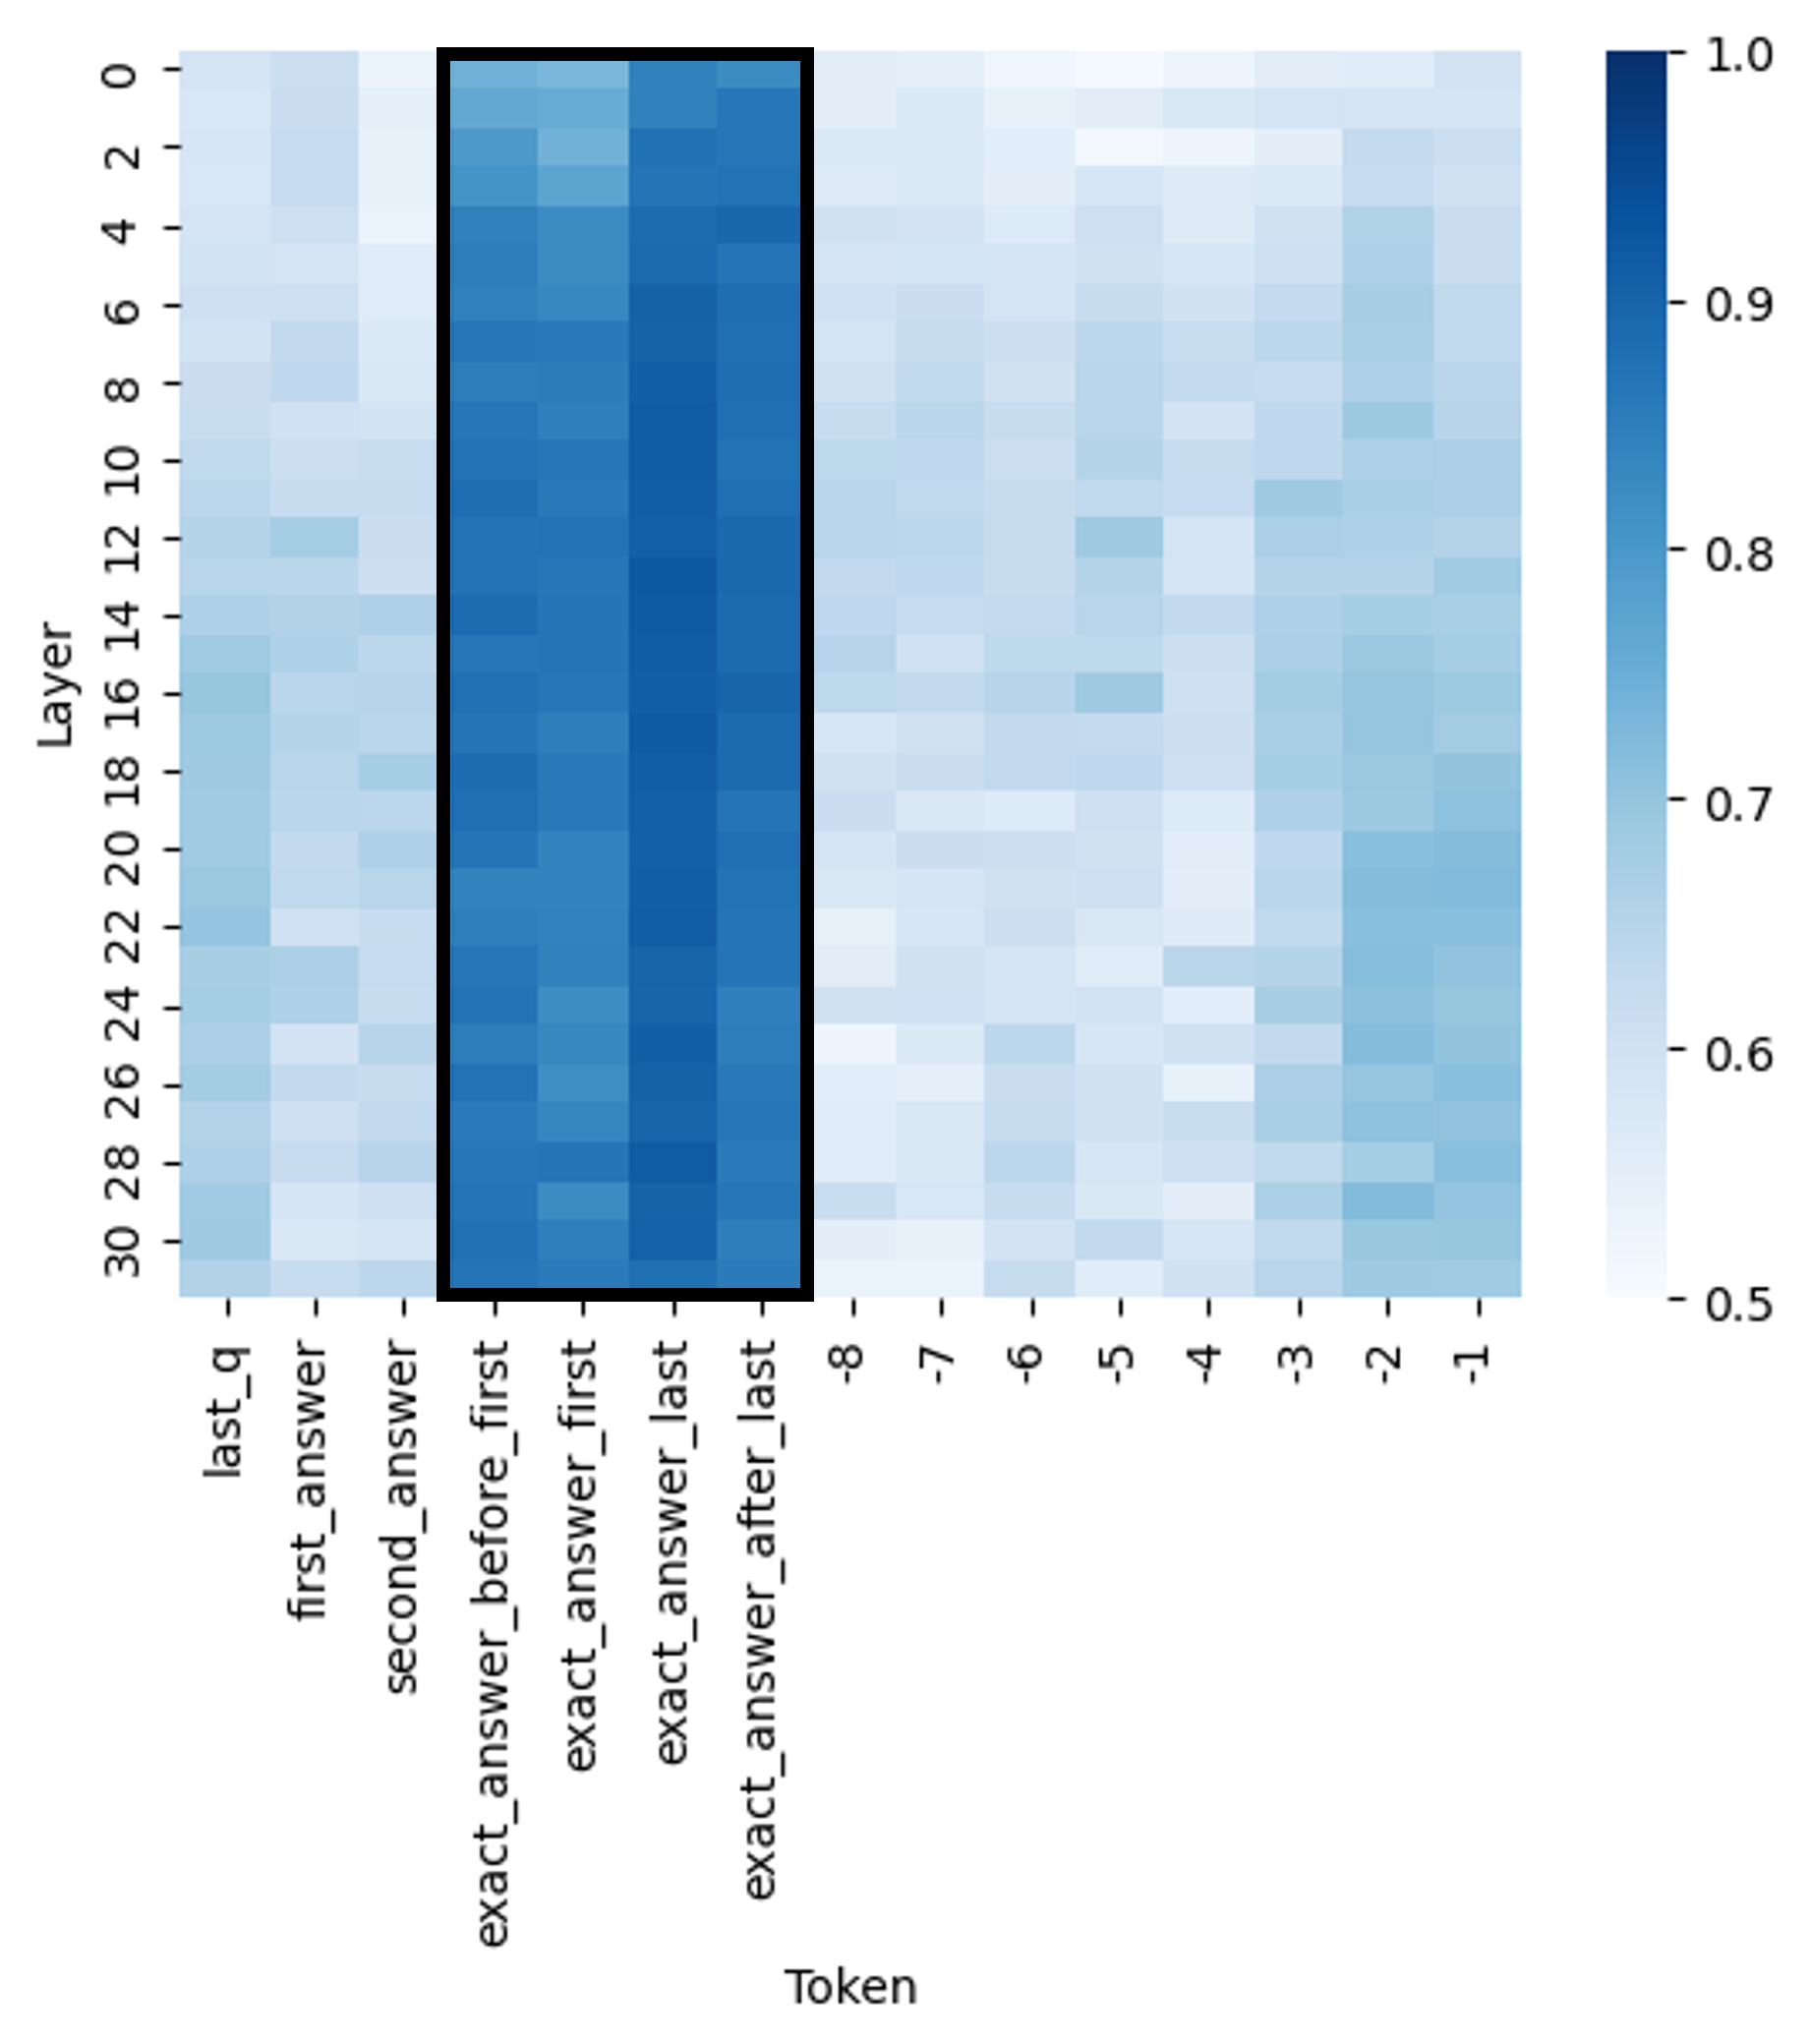
The image is a heatmap visualizing the relationship between "Layer" and "Token". The heatmap uses a blue color gradient, where darker shades of blue indicate higher values and lighter shades indicate lower values. The vertical axis represents "Layer" with numerical values from 0 to 30. The horizontal axis represents "Token" with categorical values including "last_q", "first_answer", "second_answer", "exact_answer_before_first", "exact_answer_first", "exact_answer_last", "exact_answer_after_last", and numerical values from -8 to -1.
### Components/Axes
* **X-axis (Token):**
* Categories: last\_q, first\_answer, second\_answer, exact\_answer\_before\_first, exact\_answer\_first, exact\_answer\_last, exact\_answer\_after\_last
* Numerical: -8, -7, -6, -5, -4, -3, -2, -1
* **Y-axis (Layer):** Numerical values from 0 to 30, incrementing by 2.
* **Color Scale:** A blue gradient ranging from 0.5 (lightest blue) to 1.0 (darkest blue).
### Detailed Analysis
The heatmap shows distinct patterns based on the token type and layer.
* **Tokens "exact\_answer\_before\_first", "exact\_answer\_first", "exact\_answer\_last", and "exact\_answer\_after\_last":** These tokens exhibit the highest values (darkest blue) across all layers. The values are approximately 0.9 to 1.0.
* **Token "last\_q":** This token shows relatively lower values (lighter blue) across all layers, generally ranging from 0.5 to 0.7.
* **Tokens "first\_answer" and "second\_answer":** These tokens have intermediate values, generally between 0.6 and 0.8.
* **Numerical Tokens (-8 to -1):** These tokens show a mix of values, with some layers having higher values than others. The values range from 0.5 to 0.8.
**Specific Data Points (Approximate):**
* Layer 0, Token last\_q: Approximately 0.6
* Layer 0, Token exact\_answer\_first: Approximately 0.9
* Layer 30, Token last\_q: Approximately 0.5
* Layer 30, Token exact\_answer\_first: Approximately 0.9
### Key Observations
* The tokens related to "exact\_answer" consistently show high values across all layers.
* The token "last\_q" consistently shows low values across all layers.
* There is some variation in values for the numerical tokens (-8 to -1) depending on the layer.
### Interpretation
The heatmap suggests that the "exact\_answer" tokens are highly relevant or important across all layers, as indicated by their high values. The "last\_q" token, on the other hand, appears to be less relevant or important. The varying values for the numerical tokens (-8 to -1) indicate that their relevance or importance may depend on the specific layer. The data demonstrates a clear distinction in the importance or relevance of different token types across the layers.