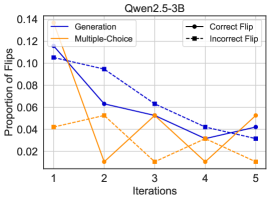
## Chart: Proportion of Flips vs. Iterations for Qwen2.5-3B
### Overview
The image is a line chart comparing the proportion of flips (correct and incorrect) across iterations for two different methods: Generation and Multiple-Choice, using the Qwen2.5-3B model. The x-axis represents iterations (1 to 5), and the y-axis represents the proportion of flips (0 to 0.14).
### Components/Axes
* **Title:** Qwen2.5-3B
* **X-axis:** Iterations (1, 2, 3, 4, 5)
* **Y-axis:** Proportion of Flips (0.00, 0.02, 0.04, 0.06, 0.08, 0.10, 0.12, 0.14)
* **Legend:** Located at the top-left and top-right of the chart.
* **Generation:** Solid dark blue line.
* **Multiple-Choice:** Solid orange line.
* **Correct Flip:** Dashed dark blue line with square markers.
* **Incorrect Flip:** Dashed orange line with square markers.
### Detailed Analysis
* **Generation (Solid Dark Blue Line):**
* Trend: Decreasing overall.
* Data Points:
* Iteration 1: Approximately 0.105
* Iteration 2: Approximately 0.063
* Iteration 3: Approximately 0.054
* Iteration 4: Approximately 0.041
* Iteration 5: Approximately 0.032
* **Multiple-Choice (Solid Orange Line):**
* Trend: Fluctuating, with peaks at iterations 1, 3, and 5.
* Data Points:
* Iteration 1: Approximately 0.042
* Iteration 2: Approximately 0.012
* Iteration 3: Approximately 0.012
* Iteration 4: Approximately 0.008
* Iteration 5: Approximately 0.053
* **Correct Flip (Dashed Dark Blue Line with Square Markers):**
* Trend: Decreasing overall.
* Data Points:
* Iteration 1: Approximately 0.112
* Iteration 2: Approximately 0.094
* Iteration 3: Approximately 0.062
* Iteration 4: Approximately 0.042
* Iteration 5: Approximately 0.042
* **Incorrect Flip (Dashed Orange Line with Square Markers):**
* Trend: Fluctuating, with peaks at iterations 1, 3, and 5.
* Data Points:
* Iteration 1: Approximately 0.042
* Iteration 2: Approximately 0.053
* Iteration 3: Approximately 0.012
* Iteration 4: Approximately 0.053
* Iteration 5: Approximately 0.012
### Key Observations
* The "Generation" method and "Correct Flip" show a decreasing trend in the proportion of flips as iterations increase.
* The "Multiple-Choice" method and "Incorrect Flip" show a fluctuating trend, with peaks at iterations 1, 3, and 5.
* The "Generation" method starts with a higher proportion of flips compared to "Multiple-Choice," but the difference decreases over iterations.
* The "Correct Flip" method starts with a higher proportion of flips compared to "Incorrect Flip," but the difference decreases over iterations.
### Interpretation
The chart suggests that the "Generation" method and "Correct Flip" become more stable or accurate over iterations, as indicated by the decreasing proportion of flips. In contrast, the "Multiple-Choice" method and "Incorrect Flip" do not show a consistent improvement, with the proportion of flips fluctuating across iterations. This could indicate that the "Generation" method is more effective in reducing errors or instability over time compared to the "Multiple-Choice" method for the Qwen2.5-3B model. The fluctuating nature of "Multiple-Choice" and "Incorrect Flip" might suggest that this method is more sensitive to the specific characteristics of each iteration or that it requires further optimization to achieve consistent performance.