## Line Chart: Proportion of Flips vs. Iterations (Qwen2.5-3B)
### Overview
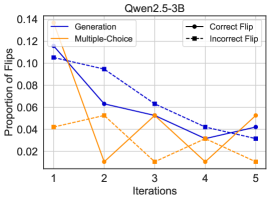
This line chart depicts the proportion of flips across different iterations for various methods: Generation, Multiple-Choice, Correct Flip, and Incorrect Flip. The chart appears to be evaluating the performance of a model (Qwen2.5-3B) over iterative improvements. The x-axis represents the iteration number, and the y-axis represents the proportion of flips.
### Components/Axes
* **Title:** Qwen2.5-3B (top-center)
* **X-axis Label:** Iterations (bottom-center)
* Axis Markers: 1, 2, 3, 4, 5
* **Y-axis Label:** Proportion of Flips (left-center)
* Axis Scale: 0.02 to 0.14
* **Legend:** Located at the top-right of the chart.
* Generation (Solid Blue Line)
* Multiple-Choice (Solid Orange Line)
* Correct Flip (Solid Black Line with Circle Markers)
* Incorrect Flip (Dashed Black Line with Square Markers)
### Detailed Analysis
* **Generation (Blue Line):** The line slopes downward from iteration 1 to iteration 4, then slightly increases at iteration 5.
* Iteration 1: Approximately 0.11
* Iteration 2: Approximately 0.07
* Iteration 3: Approximately 0.06
* Iteration 4: Approximately 0.04
* Iteration 5: Approximately 0.045
* **Multiple-Choice (Orange Line):** This line exhibits a more volatile pattern. It increases from iteration 1 to iteration 2, decreases sharply to iteration 3, then fluctuates between iterations 4 and 5.
* Iteration 1: Approximately 0.04
* Iteration 2: Approximately 0.06
* Iteration 3: Approximately 0.02
* Iteration 4: Approximately 0.015
* Iteration 5: Approximately 0.04
* **Correct Flip (Black Line with Circles):** The line generally slopes downward, with some fluctuations.
* Iteration 1: Approximately 0.10
* Iteration 2: Approximately 0.08
* Iteration 3: Approximately 0.055
* Iteration 4: Approximately 0.035
* Iteration 5: Approximately 0.03
* **Incorrect Flip (Dashed Black Line with Squares):** This line shows a decreasing trend, with a relatively stable value at the end.
* Iteration 1: Approximately 0.095
* Iteration 2: Approximately 0.075
* Iteration 3: Approximately 0.05
* Iteration 4: Approximately 0.025
* Iteration 5: Approximately 0.02
### Key Observations
* The "Generation" and "Correct Flip" lines show a consistent downward trend, indicating a decrease in flips as iterations progress.
* The "Multiple-Choice" line is more erratic, suggesting instability or sensitivity to the iterative process.
* The "Incorrect Flip" line also decreases, but at a slower rate than "Generation" and "Correct Flip".
* The "Multiple-Choice" line dips to its lowest point at iteration 3, while the "Generation" line reaches its lowest point at iteration 4.
### Interpretation
The chart suggests that the Qwen2.5-3B model improves with each iteration, as evidenced by the decreasing proportion of flips for the "Generation" and "Correct Flip" methods. This indicates that the model is becoming more stable and accurate over time. The "Multiple-Choice" method's fluctuating behavior could indicate that it is more sensitive to the specific data or parameters used in each iteration. The decreasing trend in "Incorrect Flip" suggests that the model is learning to avoid incorrect responses. The difference between the "Correct Flip" and "Incorrect Flip" lines could be a measure of the model's ability to distinguish between correct and incorrect solutions. The data suggests that the model is converging towards a more stable and accurate state with each iteration, but the "Multiple-Choice" method requires further investigation to understand its erratic behavior. The chart provides a quantitative assessment of the model's learning process and highlights areas for potential improvement.