## Line Chart: Qwen2.5-3B
### Overview
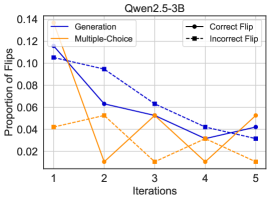
The image is a line chart titled "Qwen2.5-3B" that plots the "Proportion of Flips" against the number of "Iterations" (from 1 to 5). It compares four different data series, distinguished by color and line style, showing how their respective proportions change over five iterative steps.
### Components/Axes
* **Title:** "Qwen2.5-3B" (centered at the top).
* **Y-Axis:** Labeled "Proportion of Flips". The scale runs from 0 to 0.14, with major tick marks at intervals of 0.02 (0, 0.02, 0.04, 0.06, 0.08, 0.10, 0.12, 0.14).
* **X-Axis:** Labeled "Iterations". The scale shows discrete integer values from 1 to 5.
* **Legend:** Positioned at the top-center of the chart area. It defines four series:
* **Generation:** Solid blue line.
* **Multiple-Choice:** Solid orange line.
* **Correct Flip:** Dashed blue line.
* **Incorrect Flip:** Dashed orange line.
### Detailed Analysis
The following data points are approximate values extracted from the chart. The trend for each series is described first, followed by the estimated values per iteration.
1. **Generation (Solid Blue Line)**
* **Trend:** Shows a sharp initial decline followed by a more gradual decrease.
* **Data Points (Approximate):**
* Iteration 1: 0.11
* Iteration 2: 0.05
* Iteration 3: 0.04
* Iteration 4: 0.035
* Iteration 5: 0.03
2. **Multiple-Choice (Solid Orange Line)**
* **Trend:** Exhibits significant fluctuation, with a sharp drop, a rise, another drop, and a final rise.
* **Data Points (Approximate):**
* Iteration 1: 0.045
* Iteration 2: 0.01
* Iteration 3: 0.05
* Iteration 4: 0.01
* Iteration 5: 0.055
3. **Correct Flip (Dashed Blue Line)**
* **Trend:** Shows a steady, monotonic decline across all iterations.
* **Data Points (Approximate):**
* Iteration 1: 0.11
* Iteration 2: 0.09
* Iteration 3: 0.065
* Iteration 4: 0.045
* Iteration 5: 0.035
4. **Incorrect Flip (Dashed Orange Line)**
* **Trend:** Fluctuates, with an initial rise, a sharp dip, and a subsequent recovery.
* **Data Points (Approximate):**
* Iteration 1: 0.045
* Iteration 2: 0.06
* Iteration 3: 0.015
* Iteration 4: 0.025
* Iteration 5: 0.04
### Key Observations
* **Initial Convergence:** At Iteration 1, the "Generation" and "Correct Flip" series start at the same high point (~0.11), while the "Multiple-Choice" and "Incorrect Flip" series start at the same lower point (~0.045).
* **Diverging Paths:** After the first iteration, the paths of the series diverge significantly. The blue lines (Generation, Correct Flip) generally trend downward, while the orange lines (Multiple-Choice, Incorrect Flip) show more volatility.
* **Final Values:** By Iteration 5, all series have converged to a narrower range between approximately 0.03 and 0.055. The "Multiple-Choice" series ends at the highest value (~0.055), while "Generation" ends at the lowest (~0.03).
* **Volatility:** The "Multiple-Choice" series displays the most dramatic swings between iterations, particularly between iterations 2, 3, and 4.
### Interpretation
This chart likely visualizes the performance or behavior of a model (Qwen2.5-3B) over successive refinement or evaluation iterations. The "Proportion of Flips" metric suggests a measure of change, correction, or error rate.
* The steady decline of the **Correct Flip** (dashed blue) line indicates that the rate of beneficial or accurate changes decreases as the model iterates, possibly suggesting convergence or diminishing returns.
* The volatile path of the **Multiple-Choice** (solid orange) line implies instability or a non-monotonic response in that specific evaluation condition. Its final rise is an outlier compared to the general downward trend of other series.
* The parallel start of **Generation/Correct Flip** and **Multiple-Choice/Incorrect Flip** suggests these pairs may be intrinsically linked at the outset of the process. The subsequent divergence highlights how different evaluation methods (Generation vs. Multiple-Choice) or flip types (Correct vs. Incorrect) evolve differently over time.
* Overall, the data demonstrates that iterative processing reduces the proportion of flips for most conditions, but the path and final state are highly dependent on the specific category being measured.