## Line Chart: Proportion of Flips Across Iterations for Qwen2.5-3B
### Overview
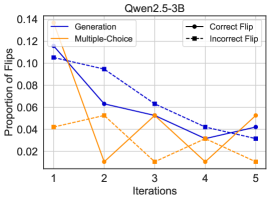
The chart illustrates the proportion of flips (correct and incorrect) for two methods—**Generation** and **Multiple-Choice**—across five iterations. The y-axis represents the proportion of flips (ranging from 0.02 to 0.14), while the x-axis denotes iterations (1 to 5). The legend, positioned in the top-right corner, distinguishes between **Correct Flip** (solid line) and **Incorrect Flip** (dashed line). The blue line (Generation) and orange line (Multiple-Choice) show distinct trends over iterations.
### Components/Axes
- **Title**: "Qwen2.5-3B" (top-center).
- **X-axis**: Labeled "Iterations" with discrete values 1, 2, 3, 4, 5.
- **Y-axis**: Labeled "Proportion of Flips" with increments of 0.02 (0.02, 0.04, 0.06, 0.08, 0.10, 0.12, 0.14).
- **Legend**: Located in the top-right corner, with:
- **Correct Flip**: Solid line (blue).
- **Incorrect Flip**: Dashed line (orange).
### Detailed Analysis
- **Generation (Blue, Solid Line)**:
- **Iteration 1**: ~0.10 (highest value).
- **Iteration 2**: ~0.08.
- **Iteration 3**: ~0.06.
- **Iteration 4**: ~0.04.
- **Iteration 5**: ~0.04.
- **Trend**: Steady decline from 0.10 to 0.04 over iterations.
- **Multiple-Choice (Orange, Dashed Line)**:
- **Iteration 1**: ~0.04 (lowest value).
- **Iteration 2**: ~0.06.
- **Iteration 3**: ~0.06.
- **Iteration 4**: ~0.06.
- **Iteration 5**: ~0.06.
- **Trend**: Slight increase from 0.04 to 0.06, stabilizing after iteration 2.
### Key Observations
1. **Generation** shows a consistent downward trend in the proportion of flips, suggesting a reduction in correct flips over iterations.
2. **Multiple-Choice** exhibits a minor upward trend, indicating an increase in incorrect flips, though it stabilizes after iteration 2.
3. The legend’s color coding (solid for correct, dashed for incorrect) aligns with the lines’ visual representation.
### Interpretation
The data suggests that the **Generation** method’s performance in terms of correct flips deteriorates as iterations increase, while the **Multiple-Choice** method’s incorrect flips rise slightly but plateau. This could imply that the Generation method becomes less reliable over time, whereas the Multiple-Choice method’s errors stabilize. The legend’s placement and color coding ensure clarity, but the lack of explicit error bars or confidence intervals limits the ability to assess statistical significance. The trends may reflect underlying algorithmic behavior or data distribution shifts across iterations.