\n
## Line Chart: ΔP vs. Layer for Qwen Models
### Overview
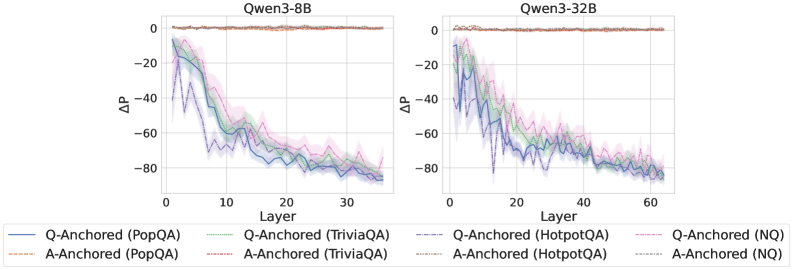
The image presents two line charts, side-by-side, displaying the change in probability (ΔP) as a function of layer number for two different Qwen models: Qwen3-8B and Qwen3-32B. Each chart contains multiple lines representing different anchoring and question-answering (QA) datasets. The charts visually compare how ΔP changes across layers for each model and dataset combination.
### Components/Axes
* **X-axis:** Layer (ranging from 0 to approximately 35 for Qwen3-8B and 0 to approximately 60 for Qwen3-32B).
* **Y-axis:** ΔP (ranging from approximately -90 to 0).
* **Models:** Qwen3-8B (left chart), Qwen3-32B (right chart).
* **Datasets/Anchoring:**
* PopQA
* TriviaQA
* HotpotQA
* NQ (Natural Questions)
* **Anchoring Types:**
* Q-Anchored
* A-Anchored
* **Legend:** Located at the bottom of the image, providing color-coded labels for each line.
### Detailed Analysis or Content Details
**Qwen3-8B (Left Chart)**
* **Q-Anchored (PopQA):** A solid blue line. Starts at approximately -10 at Layer 0, decreases steeply to approximately -80 at Layer 10, and then plateaus around -80 to -70 from Layer 20 to 35.
* **A-Anchored (PopQA):** A light orange dashed line. Starts at approximately -5 at Layer 0, decreases to approximately -60 at Layer 10, and then plateaus around -60 to -50 from Layer 20 to 35.
* **Q-Anchored (TriviaQA):** A solid purple line. Starts at approximately -15 at Layer 0, decreases steeply to approximately -70 at Layer 10, and then plateaus around -70 to -60 from Layer 20 to 35.
* **A-Anchored (TriviaQA):** A light purple dashed line. Starts at approximately -10 at Layer 0, decreases to approximately -60 at Layer 10, and then plateaus around -60 to -50 from Layer 20 to 35.
* **Q-Anchored (HotpotQA):** A solid green line. Starts at approximately -20 at Layer 0, decreases steeply to approximately -70 at Layer 10, and then plateaus around -70 to -60 from Layer 20 to 35.
* **A-Anchored (HotpotQA):** A light green dashed line. Starts at approximately -15 at Layer 0, decreases to approximately -60 at Layer 10, and then plateaus around -60 to -50 from Layer 20 to 35.
* **Q-Anchored (NQ):** A solid teal line. Starts at approximately -5 at Layer 0, decreases to approximately -40 at Layer 10, and then plateaus around -40 to -30 from Layer 20 to 35.
* **A-Anchored (NQ):** A light teal dashed line. Starts at approximately 0 at Layer 0, decreases to approximately -30 at Layer 10, and then plateaus around -30 to -20 from Layer 20 to 35.
**Qwen3-32B (Right Chart)**
* **Q-Anchored (PopQA):** A solid blue line. Starts at approximately -10 at Layer 0, decreases steeply to approximately -80 at Layer 10, and then plateaus around -80 to -70 from Layer 20 to 60.
* **A-Anchored (PopQA):** A light orange dashed line. Starts at approximately -5 at Layer 0, decreases to approximately -60 at Layer 10, and then plateaus around -60 to -50 from Layer 20 to 60.
* **Q-Anchored (TriviaQA):** A solid purple line. Starts at approximately -15 at Layer 0, decreases steeply to approximately -70 at Layer 10, and then plateaus around -70 to -60 from Layer 20 to 60.
* **A-Anchored (TriviaQA):** A light purple dashed line. Starts at approximately -10 at Layer 0, decreases to approximately -60 at Layer 10, and then plateaus around -60 to -50 from Layer 20 to 60.
* **Q-Anchored (HotpotQA):** A solid green line. Starts at approximately -20 at Layer 0, decreases steeply to approximately -70 at Layer 10, and then plateaus around -70 to -60 from Layer 20 to 60.
* **A-Anchored (HotpotQA):** A light green dashed line. Starts at approximately -15 at Layer 0, decreases to approximately -60 at Layer 10, and then plateaus around -60 to -50 from Layer 20 to 60.
* **Q-Anchored (NQ):** A solid teal line. Starts at approximately -5 at Layer 0, decreases to approximately -40 at Layer 10, and then plateaus around -40 to -30 from Layer 20 to 60.
* **A-Anchored (NQ):** A light teal dashed line. Starts at approximately 0 at Layer 0, decreases to approximately -30 at Layer 10, and then plateaus around -30 to -20 from Layer 20 to 60.
### Key Observations
* All lines exhibit a steep decrease in ΔP within the first 10 layers, regardless of the model, dataset, or anchoring type.
* After the initial decrease, ΔP plateaus, indicating diminishing changes in probability with increasing layer depth.
* Q-Anchored lines generally have lower ΔP values than A-Anchored lines for the same dataset.
* The NQ dataset consistently shows the smallest decrease in ΔP compared to other datasets.
* The Qwen3-32B model shows a similar trend to Qwen3-8B, but extends to a greater layer depth (60 layers vs. 35 layers).
### Interpretation
The charts demonstrate how the change in probability (ΔP) evolves across layers in the Qwen models when evaluated on different question-answering datasets. The initial steep decline in ΔP suggests that the early layers of the models are responsible for capturing the most significant changes in probability related to the QA tasks. The subsequent plateau indicates that deeper layers contribute less to these changes.
The difference between Q-Anchored and A-Anchored lines suggests that the anchoring method influences the model's probability distribution. Q-Anchoring, which likely involves anchoring on the question itself, leads to a more pronounced decrease in ΔP, potentially indicating a stronger focus on the question's context.
The relatively small decrease in ΔP for the NQ dataset might suggest that this dataset is easier for the models to process or that the models already have a strong understanding of the concepts involved in NQ questions.
The similarity in trends between the two models (Qwen3-8B and Qwen3-32B) suggests that the underlying architecture and learning process are consistent, despite the difference in model size. The extended layer depth in Qwen3-32B allows for a more prolonged plateau, potentially indicating a greater capacity for nuanced representation.