# Technical Document: Scatter Plot Analysis
## Legend and Labels
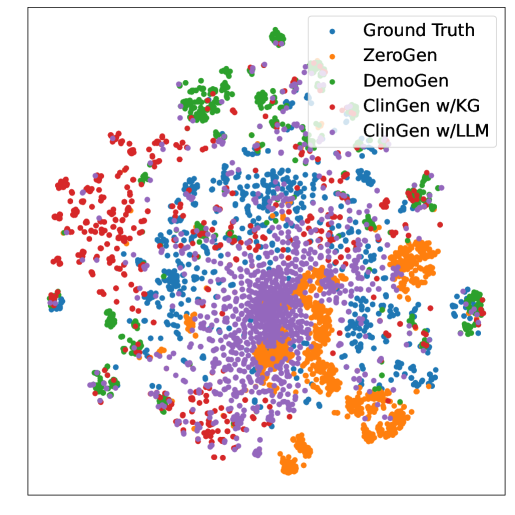
- **Legend Entries**:
- **Blue Dots**: Ground Truth
- **Orange Dots**: ZeroGen
- **Green Dots**: DemoGen
- **Red Dots**: ClinGen w/KG
- **Purple Dots**: ClinGen w/LLM
## Plot Structure
- **Type**: Scatter plot
- **Axes**: No explicit axis titles or markers visible in the image.
- **Distribution**:
- **Ground Truth (Blue)**: Widely dispersed across the plot, forming a diffuse cloud.
- **ZeroGen (Orange)**: Clustered in the central region, overlapping with other clusters.
- **DemoGen (Green)**: Moderately dispersed, with some overlap in the central area.
- **ClinGen w/KG (Red)**: Tightly clustered in the central region, overlapping with ZeroGen and DemoGen.
- **ClinGen w/LLM (Purple)**: Dispersed but less than Ground Truth, with some overlap in the central region.
## Key Observations
1. **Central Clustering**: ZeroGen, DemoGen, and ClinGen w/KG exhibit strong central clustering, suggesting similar performance or characteristics in the measured space.
2. **Ground Truth Dispersion**: The Ground Truth data points are more spread out, indicating variability in the reference dataset.
3. **ClinGen w/LLM**: Shows intermediate dispersion compared to Ground Truth and other models, with some points extending toward the periphery.
## Notes
- No explicit numerical data, axis scales, or categorical sub-labels are visible in the image.
- The plot emphasizes qualitative clustering patterns rather than quantitative metrics.