## Chart: Validation Loss vs. Training Data Size
### Overview
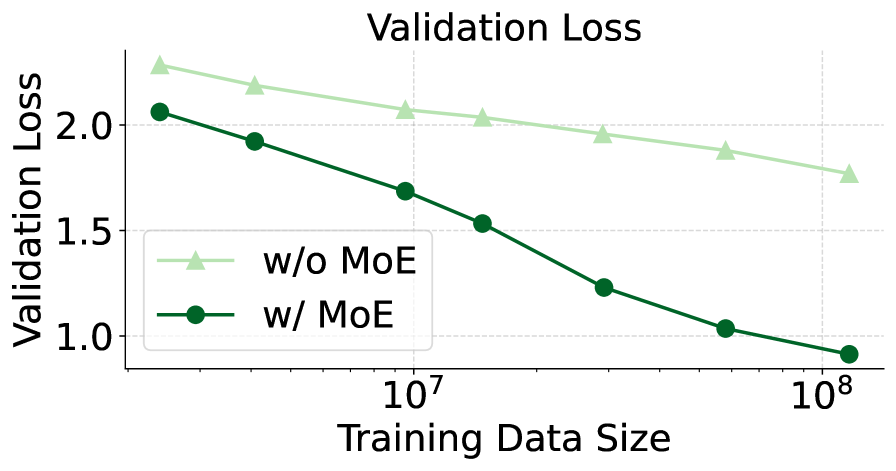
The image is a line chart comparing the validation loss of a model with and without the use of Mixture of Experts (MoE) as the training data size increases. The x-axis represents the training data size on a logarithmic scale, and the y-axis represents the validation loss.
### Components/Axes
* **Title:** Validation Loss
* **X-axis:** Training Data Size (logarithmic scale)
* Axis markers: 10<sup>7</sup>, 10<sup>8</sup>
* **Y-axis:** Validation Loss
* Axis markers: 1.0, 1.5, 2.0
* **Legend:** Located in the center of the chart.
* Light Green line with triangle markers: "w/o MoE" (without Mixture of Experts)
* Dark Green line with circle markers: "w/ MoE" (with Mixture of Experts)
### Detailed Analysis
* **"w/o MoE" (without Mixture of Experts) - Light Green Line:**
* Trend: The line slopes downward, indicating a decrease in validation loss as the training data size increases.
* Data Points:
* At 10<sup>7</sup> Training Data Size: Validation Loss ≈ 2.2
* At 10<sup>8</sup> Training Data Size: Validation Loss ≈ 1.8
* **"w/ MoE" (with Mixture of Experts) - Dark Green Line:**
* Trend: The line slopes downward, indicating a decrease in validation loss as the training data size increases. The slope appears steeper than the "w/o MoE" line.
* Data Points:
* At 10<sup>7</sup> Training Data Size: Validation Loss ≈ 1.7
* At 10<sup>8</sup> Training Data Size: Validation Loss ≈ 0.85
### Key Observations
* Both lines show a decrease in validation loss as the training data size increases.
* The model "w/ MoE" consistently has a lower validation loss than the model "w/o MoE" for the given range of training data sizes.
* The "w/ MoE" line shows a more significant decrease in validation loss as the training data size increases compared to the "w/o MoE" line.
### Interpretation
The chart suggests that using Mixture of Experts (MoE) in the model leads to a lower validation loss compared to not using MoE, given the same training data size. The steeper downward slope of the "w/ MoE" line indicates that the model with MoE benefits more from increased training data size, resulting in a more substantial reduction in validation loss. This implies that MoE is an effective technique for improving the model's performance, especially as the amount of training data grows.