\n
## Line Chart: Validation Loss vs. Training Data Size
### Overview
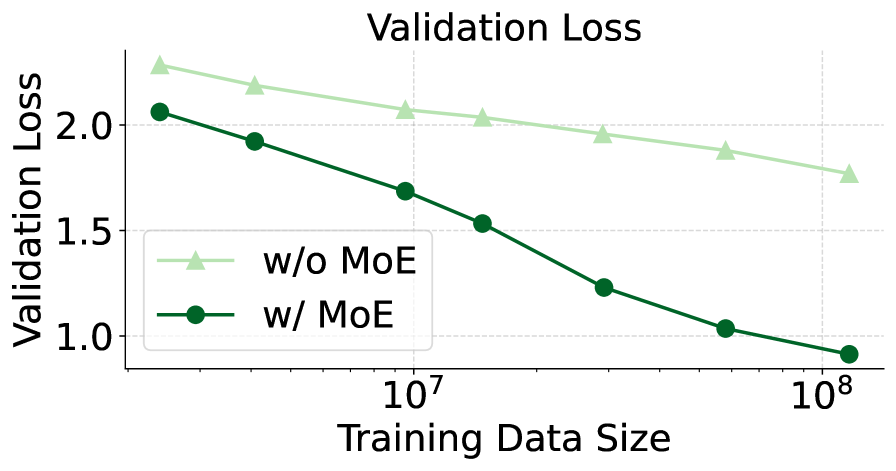
This line chart depicts the relationship between validation loss and training data size for two models: one without Mixture of Experts (MoE) and one with MoE. The chart illustrates how validation loss changes as the amount of training data increases.
### Components/Axes
* **Title:** "Validation Loss" (centered at the top)
* **X-axis:** "Training Data Size" (horizontal axis) - Scale is logarithmic, with markings at 10<sup>7</sup> and 10<sup>8</sup>.
* **Y-axis:** "Validation Loss" (vertical axis) - Scale ranges from approximately 0.8 to 2.4.
* **Legend:** Located in the top-left corner.
* "w/o MoE" (light green triangle marker)
* "w/ MoE" (dark green circle marker)
* **Gridlines:** Horizontal gray gridlines are present to aid in reading values.
### Detailed Analysis
**w/o MoE (Light Green Line):**
The light green line representing the model without MoE starts at approximately 2.3 validation loss at the leftmost data point (corresponding to 10<sup>7</sup> training data size). The line slopes downward, but at a decreasing rate, reaching approximately 1.7 validation loss at the rightmost data point (corresponding to 10<sup>8</sup> training data size).
* Data Point 1 (10<sup>7</sup>): Validation Loss ≈ 2.3
* Data Point 2 (between 10<sup>7</sup> and 10<sup>8</sup>): Validation Loss ≈ 2.0
* Data Point 3 (10<sup>8</sup>): Validation Loss ≈ 1.7
**w/ MoE (Dark Green Line):**
The dark green line representing the model with MoE begins at approximately 2.0 validation loss at the leftmost data point (corresponding to 10<sup>7</sup> training data size). This line exhibits a steeper downward slope than the "w/o MoE" line, decreasing rapidly to approximately 1.2 validation loss at an intermediate point, and finally reaching approximately 0.9 validation loss at the rightmost data point (corresponding to 10<sup>8</sup> training data size).
* Data Point 1 (10<sup>7</sup>): Validation Loss ≈ 2.0
* Data Point 2 (between 10<sup>7</sup> and 10<sup>8</sup>): Validation Loss ≈ 1.2
* Data Point 3 (10<sup>8</sup>): Validation Loss ≈ 0.9
### Key Observations
* The model *with* MoE consistently exhibits lower validation loss than the model *without* MoE across all training data sizes.
* The benefit of using MoE is more pronounced as the training data size increases. The gap between the two lines widens as you move towards the right of the chart.
* Both models demonstrate diminishing returns in terms of validation loss reduction as the training data size increases. The slope of both lines decreases as data size grows.
### Interpretation
The data strongly suggests that incorporating Mixture of Experts (MoE) into the model leads to improved performance, as measured by validation loss. This improvement becomes more significant with larger training datasets. The steeper decline in validation loss for the MoE model indicates that it is better able to generalize from the data, potentially due to its increased capacity and ability to specialize different parts of the model to different aspects of the data. The diminishing returns observed for both models suggest that there may be a point beyond which adding more training data provides only marginal improvements in validation loss. This could be due to the model reaching its capacity or the data becoming saturated with information. The logarithmic scale on the x-axis is important to note, as it indicates that the benefit of increased data size is not linear.