\n
## Scatter Plot: Accuracy vs. Time-to-Answer for Different k Values
### Overview
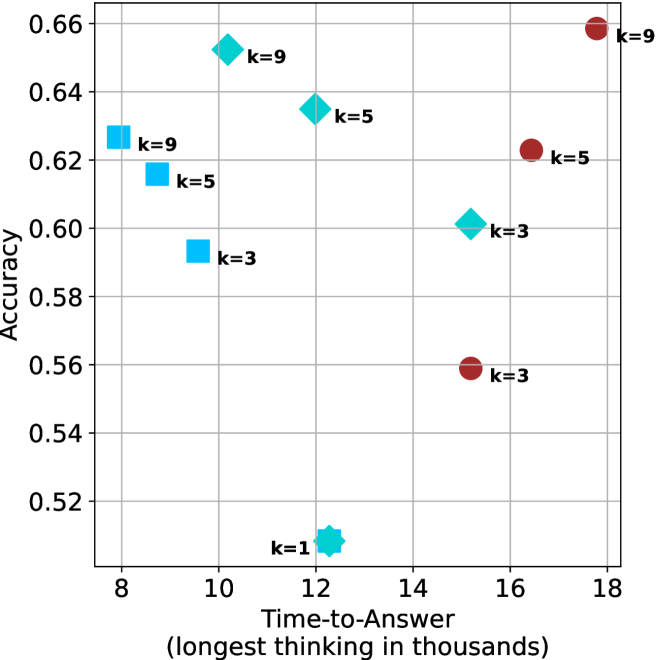
This image presents a scatter plot illustrating the relationship between Accuracy and Time-to-Answer (measured in thousands of units) for different values of 'k'. Each point on the plot represents a data point for a specific 'k' value. The plot appears to explore the trade-off between accuracy and response time as the parameter 'k' varies.
### Components/Axes
* **X-axis:** Time-to-Answer (longest thinking in thousands) - Scale ranges from approximately 8 to 18.
* **Y-axis:** Accuracy - Scale ranges from approximately 0.52 to 0.66.
* **Data Points:** Represented by colored markers. Each marker is labeled with its corresponding 'k' value.
* **'k' Values:** The parameter 'k' takes on the values 1, 3, 5, and 9.
* **Colors:**
* Blue: Represents k = 1, k = 3, and k = 5.
* Red: Represents k = 3, k = 5, and k = 9.
### Detailed Analysis
The plot contains several data points, each representing a specific combination of Time-to-Answer, Accuracy, and 'k' value.
* **k = 1:** One data point at approximately (12.5, 0.52).
* **k = 3:** Two data points: approximately (9.8, 0.59) and (15.8, 0.56).
* **k = 5:** Two data points: approximately (10.2, 0.62) and (16.5, 0.62).
* **k = 9:** Two data points: approximately (9.5, 0.62) and (17.8, 0.66).
**Trends:**
* For k = 3, the accuracy decreases as the time-to-answer increases.
* For k = 5, the accuracy remains relatively constant as the time-to-answer increases.
* For k = 9, the accuracy increases as the time-to-answer increases.
* Generally, as 'k' increases, the accuracy tends to increase, but this is not a consistent trend across all time-to-answer values.
### Key Observations
* The data points are not evenly distributed. There are multiple points for k=3, k=5, and k=9, but only one for k=1.
* The highest accuracy is achieved with k=9 at a time-to-answer of approximately 17.8.
* The lowest accuracy is achieved with k=1 at a time-to-answer of approximately 12.5.
* There is overlap in the accuracy range for different 'k' values, indicating that achieving a certain level of accuracy can be done with different 'k' settings.
### Interpretation
The scatter plot suggests a complex relationship between accuracy, time-to-answer, and the parameter 'k'. The parameter 'k' likely controls some aspect of the system being evaluated, such as the number of candidates considered or the complexity of the search process.
The data indicates that increasing 'k' generally improves accuracy, but also increases the time-to-answer. This suggests a trade-off between performance and accuracy. The optimal value of 'k' depends on the specific application and the relative importance of accuracy and speed.
The differing trends observed for different 'k' values suggest that the relationship between accuracy and time-to-answer is not linear and may be influenced by the specific value of 'k'. The presence of multiple data points for some 'k' values could indicate that the system's performance varies under similar conditions, or that the data represents multiple trials or runs.
The plot does not provide information about the nature of the task being performed or the underlying mechanism that governs the relationship between these variables. Further investigation would be needed to understand the specific implications of these findings.