## Scatter Plot: Accuracy vs. Time-to-Answer (Longest Thinking in Thousands)
### Overview
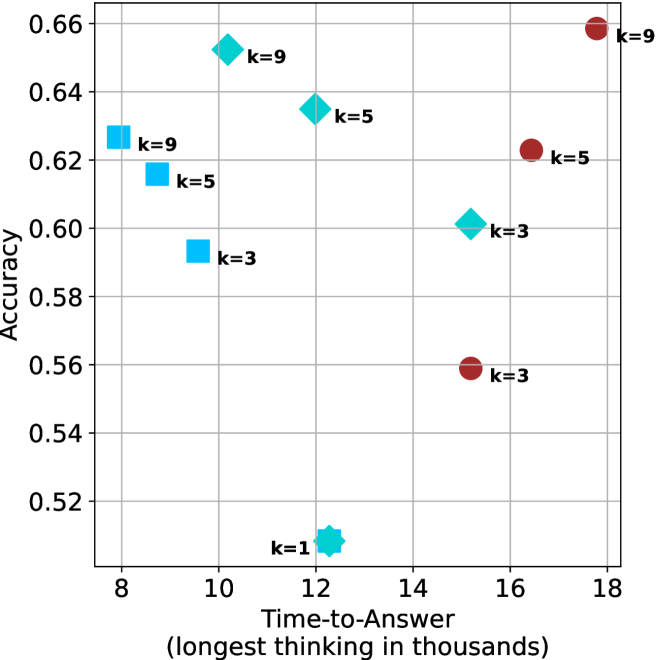
The image is a scatter plot comparing **Accuracy** (y-axis) against **Time-to-Answer (longest thinking in thousands)** (x-axis). Data points are color-coded and labeled with "k" values (3, 5, 9, and 1), representing different experimental conditions or parameters. The plot includes a legend in the top-right corner and gridlines for reference.
---
### Components/Axes
- **X-axis (Time-to-Answer)**: Labeled "Time-to-Answer (longest thinking in thousands)" with values ranging from 8 to 18 (in thousands of units).
- **Y-axis (Accuracy)**: Labeled "Accuracy" with values ranging from 0.52 to 0.66.
- **Legend**: Positioned at the top-right corner, mapping colors to "k" values:
- **Blue squares**: k=3
- **Cyan diamonds**: k=5
- **Red circles**: k=9
- **Cyan star**: k=1 (not explicitly in legend but present in data).
---
### Detailed Analysis
#### Data Points
1. **k=3 (Blue Squares)**:
- (10, 0.62)
- (12, 0.58)
- (11, 0.52) [cyan star, labeled k=1 but colored cyan].
2. **k=5 (Cyan Diamonds)**:
- (10, 0.65)
- (12, 0.64)
- (16, 0.62)
3. **k=9 (Red Circles)**:
- (16, 0.66)
- (18, 0.66)
4. **k=1 (Cyan Star)**:
- (11, 0.52) [outlier, not in legend].
---
### Key Observations
1. **Trend Verification**:
- **k=3**: Points cluster at lower x-values (10–12) with accuracies between 0.58–0.62.
- **k=5**: Points span x-values 10–16, with accuracies 0.62–0.65.
- **k=9**: Points at higher x-values (16–18) with accuracies 0.62–0.66.
- **k=1**: Single outlier at (11, 0.52), lower accuracy than other k values.
2. **Spatial Grounding**:
- Legend is top-right, clearly associating colors with k-values.
- Data points are spatially grouped by k-value, with higher k-values (e.g., k=9) positioned toward the upper-right (higher accuracy and longer time).
3. **Anomalies**:
- The k=1 point (cyan star) deviates from the legend’s color coding (cyan = k=5) and has the lowest accuracy.
---
### Interpretation
- **Positive Correlation**: Higher k-values (longer thinking time) generally correspond to higher accuracy, suggesting a trade-off between computational effort and performance.
- **Outlier Analysis**: The k=1 point (11, 0.52) may represent an edge case or measurement error, as it contradicts the legend’s color coding and underperforms compared to other k-values.
- **Practical Implication**: Increasing "k" (e.g., from 3 to 9) improves accuracy but requires significantly more time, highlighting a potential optimization challenge.
This plot demonstrates that extended thinking time (higher k) enhances accuracy, though the relationship is not strictly linear and includes exceptions.