## Line Chart: WinRate/ASR vs. Ratio of Training Data
### Overview
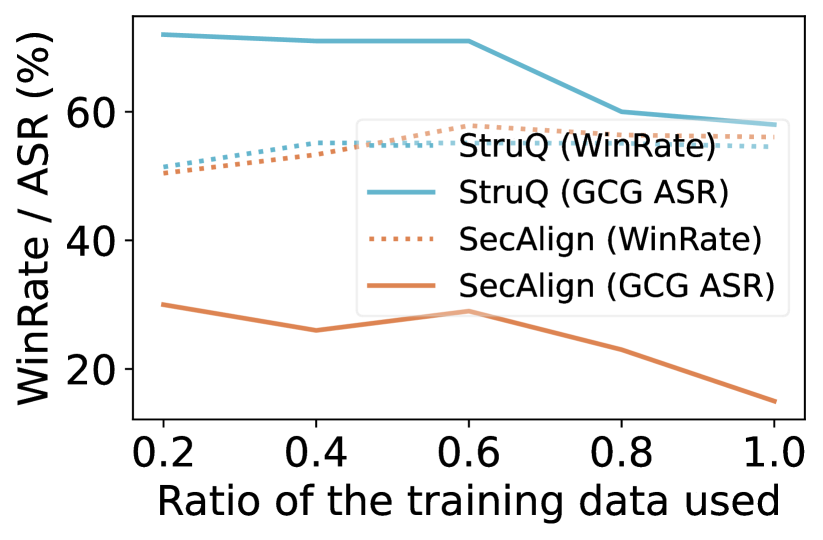
The image is a line chart comparing the WinRate and Automatic Speech Recognition (ASR) performance of two models, StruQ and SecAlign, against the ratio of training data used. The x-axis represents the ratio of training data used, ranging from 0.2 to 1.0. The y-axis represents the WinRate/ASR in percentage, ranging from 20% to 80%. The chart includes a legend to distinguish between the different data series.
### Components/Axes
* **X-axis:**
* Label: "Ratio of the training data used"
* Scale: 0.2, 0.4, 0.6, 0.8, 1.0
* **Y-axis:**
* Label: "WinRate / ASR (%)"
* Scale: 20, 40, 60, 80
* **Legend (Top-Right):**
* StruQ (WinRate): Dotted light brown line
* StruQ (GCG ASR): Solid light blue line
* SecAlign (WinRate): Dotted brown line
* SecAlign (GCG ASR): Solid brown line
### Detailed Analysis
* **StruQ (WinRate):**
* Line Type: Dotted light brown
* Trend: Slightly increasing, then plateaus
* Data Points:
* 0.2: ~50%
* 0.4: ~53%
* 0.6: ~55%
* 0.8: ~56%
* 1.0: ~55%
* **StruQ (GCG ASR):**
* Line Type: Solid light blue
* Trend: Decreasing
* Data Points:
* 0.2: ~75%
* 0.4: ~73%
* 0.6: ~73%
* 0.8: ~60%
* 1.0: ~57%
* **SecAlign (WinRate):**
* Line Type: Dotted brown
* Trend: Increasing, then plateaus
* Data Points:
* 0.2: ~50%
* 0.4: ~53%
* 0.6: ~55%
* 0.8: ~56%
* 1.0: ~55%
* **SecAlign (GCG ASR):**
* Line Type: Solid brown
* Trend: Decreasing
* Data Points:
* 0.2: ~30%
* 0.4: ~26%
* 0.6: ~28%
* 0.8: ~20%
* 1.0: ~15%
### Key Observations
* StruQ (GCG ASR) starts with the highest performance but decreases as the ratio of training data increases.
* SecAlign (GCG ASR) has the lowest performance and decreases significantly as the ratio of training data increases.
* WinRate for both StruQ and SecAlign models increases slightly and then plateaus as the ratio of training data increases.
* The WinRate performance of StruQ and SecAlign are nearly identical.
### Interpretation
The chart suggests that increasing the ratio of training data has a negative impact on the GCG ASR performance of both StruQ and SecAlign models. The WinRate performance, however, remains relatively stable or slightly increases with more training data. This could indicate that the models are overfitting to the training data when it comes to ASR, while the WinRate is less sensitive to the amount of training data. The StruQ model generally outperforms the SecAlign model in terms of GCG ASR, while their WinRates are nearly identical.