\n
## Line Chart: WinRate/ASR vs. Training Data Ratio
### Overview
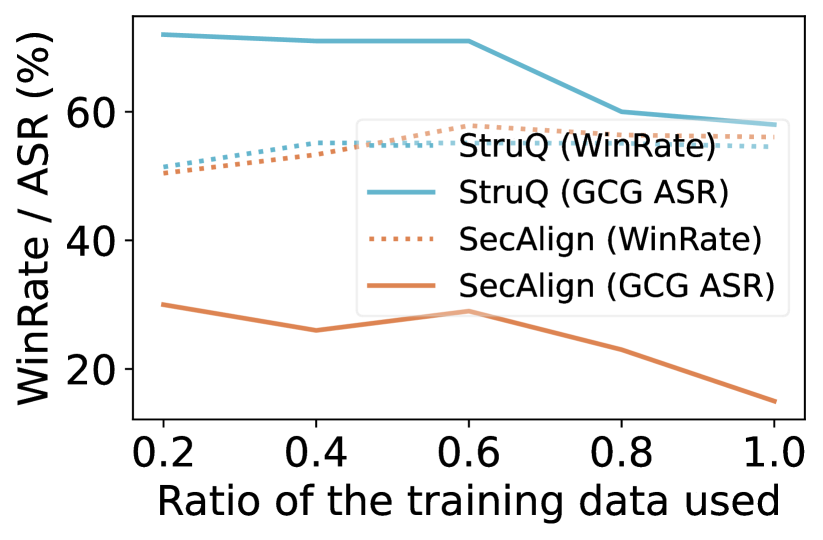
This line chart depicts the relationship between the ratio of training data used and the WinRate/ASR (Automatic Speech Recognition) performance for two models: StruQ and SecAlign. The chart compares the WinRate and ASR metrics for each model as the amount of training data varies.
### Components/Axes
* **X-axis:** "Ratio of the training data used". Scale ranges from 0.2 to 1.0, with markers at 0.2, 0.4, 0.6, 0.8, and 1.0.
* **Y-axis:** "WinRate / ASR (%)". Scale ranges from 0 to 60, with markers at 0, 20, 40, and 60.
* **Legend:** Located in the top-right corner. Contains the following entries:
* "StruQ (GCG ASR)" - Solid blue line.
* "SecAlign (WinRate)" - Dotted orange line.
* "StruQ (WinRate)" - Solid teal line.
* "SecAlign (GCG ASR)" - Solid orange line.
### Detailed Analysis
* **StruQ (GCG ASR) - Blue Line:** This line starts at approximately 62% at a training data ratio of 0.2. It remains relatively stable until a ratio of 0.6, where it begins to decline sharply, reaching approximately 54% at a ratio of 1.0.
* **SecAlign (WinRate) - Dotted Orange Line:** This line begins at approximately 48% at a ratio of 0.2. It shows a slight upward trend, peaking at around 53% at a ratio of 0.4, then declines to approximately 35% at a ratio of 1.0.
* **StruQ (WinRate) - Teal Line:** This line starts at approximately 70% at a ratio of 0.2. It decreases steadily to approximately 58% at a ratio of 1.0.
* **SecAlign (GCG ASR) - Orange Line:** This line begins at approximately 28% at a ratio of 0.2. It initially decreases to around 24% at a ratio of 0.4, then declines more rapidly to approximately 18% at a ratio of 1.0.
### Key Observations
* StruQ (WinRate) consistently outperforms all other metrics across all training data ratios.
* SecAlign (GCG ASR) exhibits the lowest performance across all training data ratios.
* Both models show a general trend of decreasing performance as the training data ratio approaches 1.0, although the rate of decline varies.
* The performance of SecAlign (WinRate) initially increases with more training data, but eventually declines.
### Interpretation
The chart suggests that while increasing the amount of training data generally improves model performance, there appears to be a point of diminishing returns, and potentially even a negative impact on performance beyond a certain threshold. This could be due to overfitting, data quality issues, or other factors. The significant difference in performance between the two models (StruQ and SecAlign) indicates that the underlying architectures or training procedures have a substantial impact on the final results. The differing trends for WinRate and ASR within each model suggest that these metrics are influenced by different aspects of the training data and model parameters. The initial increase in SecAlign (WinRate) could be due to the model learning basic patterns from the data, but the subsequent decline might indicate that the model is struggling to generalize to unseen data as the training set becomes more complex. The chart highlights the importance of carefully evaluating the impact of training data size and quality on model performance, and of considering multiple metrics to gain a comprehensive understanding of the model's capabilities.