## [Line Chart]: Performance of StruQ and SecAlign vs. Training Data Ratio
### Overview
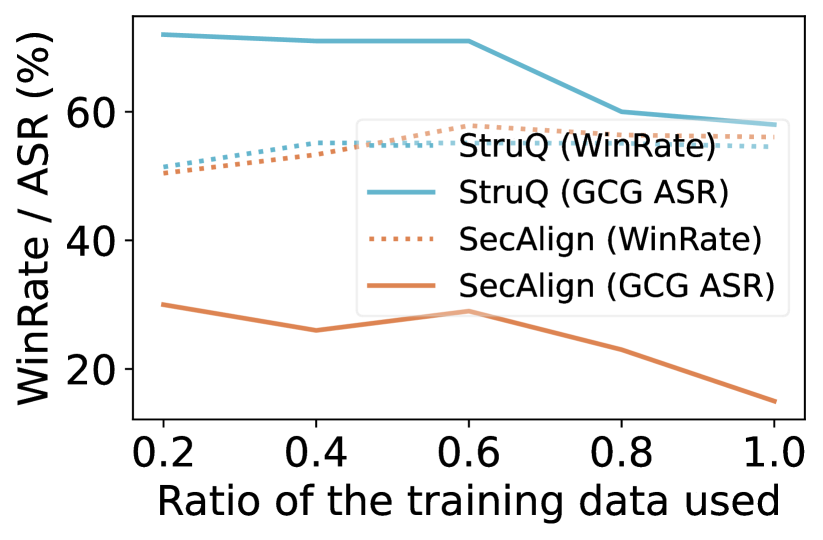
This image is a line chart comparing the performance of two methods, **StruQ** and **SecAlign**, across two metrics (**WinRate** and **GCG ASR**) as the ratio of training data used increases from 0.2 to 1.0. The chart demonstrates how each method's performance changes with more training data.
### Components/Axes
* **X-Axis:** Labeled "Ratio of the training data used". It has major tick marks at 0.2, 0.4, 0.6, 0.8, and 1.0.
* **Y-Axis:** Labeled "WinRate / ASR (%)". It has major tick marks at 20, 40, and 60.
* **Legend:** Positioned in the center-right area of the chart. It contains four entries:
1. `StruQ (WinRate)`: Represented by a light blue, dotted line.
2. `StruQ (GCG ASR)`: Represented by a solid, light blue line.
3. `SecAlign (WinRate)`: Represented by an orange, dotted line.
4. `SecAlign (GCG ASR)`: Represented by a solid, orange line.
### Detailed Analysis
**Trend Verification & Data Point Extraction:**
1. **StruQ (GCG ASR) - Solid Light Blue Line:**
* **Trend:** The line starts high and remains relatively flat before sloping downward significantly after the 0.6 data ratio point.
* **Approximate Values:**
* At 0.2: ~72%
* At 0.4: ~71%
* At 0.6: ~70%
* At 0.8: ~60%
* At 1.0: ~58%
2. **StruQ (WinRate) - Dotted Light Blue Line:**
* **Trend:** The line shows a very slight, steady upward trend across the entire range.
* **Approximate Values:**
* At 0.2: ~51%
* At 0.4: ~53%
* At 0.6: ~55%
* At 0.8: ~55%
* At 1.0: ~55%
3. **SecAlign (WinRate) - Dotted Orange Line:**
* **Trend:** The line shows a slight upward trend, peaking around 0.6, and then levels off.
* **Approximate Values:**
* At 0.2: ~50%
* At 0.4: ~54%
* At 0.6: ~58%
* At 0.8: ~56%
* At 1.0: ~56%
4. **SecAlign (GCG ASR) - Solid Orange Line:**
* **Trend:** The line fluctuates, showing a dip at 0.4, a peak at 0.6, and then a consistent downward slope to the lowest point on the chart.
* **Approximate Values:**
* At 0.2: ~30%
* At 0.4: ~26%
* At 0.6: ~29%
* At 0.8: ~23%
* At 1.0: ~15%
### Key Observations
* **Performance Gap in ASR:** There is a large, consistent gap between the GCG ASR of StruQ (solid blue) and SecAlign (solid orange). StruQ's ASR is significantly higher at all data ratios.
* **Convergence of WinRate:** The WinRate metrics for both methods (dotted lines) are much closer in value and follow a similar, slightly increasing trend, converging around 55-56% at higher data ratios.
* **Divergent ASR Trends:** The two methods show opposite major trends for GCG ASR. StruQ's ASR decreases with more data (especially after 0.6), while SecAlign's ASR, though lower overall, also trends downward after 0.6.
* **Critical Point at 0.6:** The data ratio of 0.6 appears to be an inflection point. StruQ's ASR begins its sharp decline here, and SecAlign's WinRate peaks here before slightly declining.
### Interpretation
The data suggests a fundamental trade-off or difference in behavior between the StruQ and SecAlign methods as more training data becomes available.
* **StruQ** maintains a high Attack Success Rate (GCG ASR) but sees this advantage diminish substantially when using more than 60% of the training data. Its WinRate, however, remains stable and slightly improves, indicating its core performance is robust.
* **SecAlign** operates at a much lower ASR level, suggesting it may be more resistant to the GCG attack being measured. Its ASR also decreases with more data, reaching a very low point at the full dataset. Its WinRate performance is comparable to StruQ's, especially at higher data ratios.
* **The "Why":** The chart likely illustrates a security or robustness evaluation. A lower GCG ASR is desirable as it indicates resistance to an attack. Therefore, SecAlign appears more robust (lower ASR) while achieving similar task performance (WinRate). The decline in ASR for both methods with more data could imply that larger training sets help the models generalize better and become less susceptible to this specific adversarial attack (GCG). The sharp drop for StruQ after 0.6 might indicate a threshold where the additional data provides critical examples that break the attack's effectiveness against it.