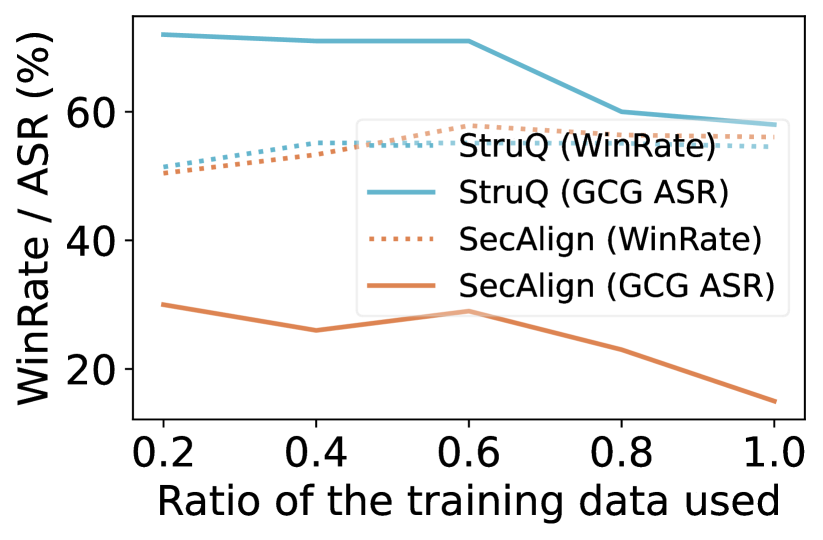
## Line Graph: WinRate/ASR Performance vs Training Data Ratio
### Overview
The graph compares the performance of two models (StruQ and SecAlign) across two metrics (WinRate and GCG ASR) as the ratio of training data used increases from 0.2 to 1.0. Four lines represent different combinations of model and metric, with performance measured in percentage.
### Components/Axes
- **X-axis**: "Ratio of the training data used" (0.2, 0.4, 0.6, 0.8, 1.0)
- **Y-axis**: "WinRate / ASR (%)" (0–80% in 20% increments)
- **Legend**:
- Solid blue: StruQ (WinRate)
- Dashed blue: StruQ (GCG ASR)
- Dotted orange: SecAlign (WinRate)
- Solid orange: SecAlign (GCG ASR)
- **Legend Position**: Top-right corner (boxed)
### Detailed Analysis
1. **StruQ (WinRate)** (solid blue):
- Starts at ~70% at 0.2 ratio.
- Remains flat until 0.6 ratio (~70%).
- Drops to ~60% at 1.0 ratio.
2. **StruQ (GCG ASR)** (dashed blue):
- Begins at ~50% at 0.2 ratio.
- Rises slightly to ~55% at 0.6 ratio.
- Declines to ~45% at 1.0 ratio.
3. **SecAlign (WinRate)** (dotted orange):
- Starts at ~50% at 0.2 ratio.
- Peaks at ~55% at 0.6 ratio.
- Drops to ~50% at 1.0 ratio.
4. **SecAlign (GCG ASR)** (solid orange):
- Begins at ~30% at 0.2 ratio.
- Peaks at ~35% at 0.6 ratio.
- Declines sharply to ~15% at 1.0 ratio.
### Key Observations
- **StruQ Stability**: StruQ maintains higher WinRate stability across all ratios compared to SecAlign.
- **GCG ASR Decline**: Both models show declining GCG ASR as training data ratio increases beyond 0.6.
- **SecAlign Peak**: SecAlign’s GCG ASR peaks at 0.6 ratio before a steep drop, suggesting diminishing returns with more data.
- **Color Consistency**: All legend labels match line styles/colors (e.g., solid blue = StruQ WinRate).
### Interpretation
The data suggests that:
- **StruQ** performs better overall, with WinRate remaining robust even at full training data (1.0 ratio).
- **SecAlign** exhibits a non-linear relationship: its GCG ASR improves up to 0.6 ratio but deteriorates sharply with additional data, indicating potential overfitting or inefficiency at higher ratios.
- The divergence between WinRate and GCG ASR trends implies that WinRate may prioritize different aspects of performance than GCG ASR, possibly reflecting trade-offs in model design or evaluation criteria.