\n
## Scatter Plot: Accuracy vs. Time-to-Answer
### Overview
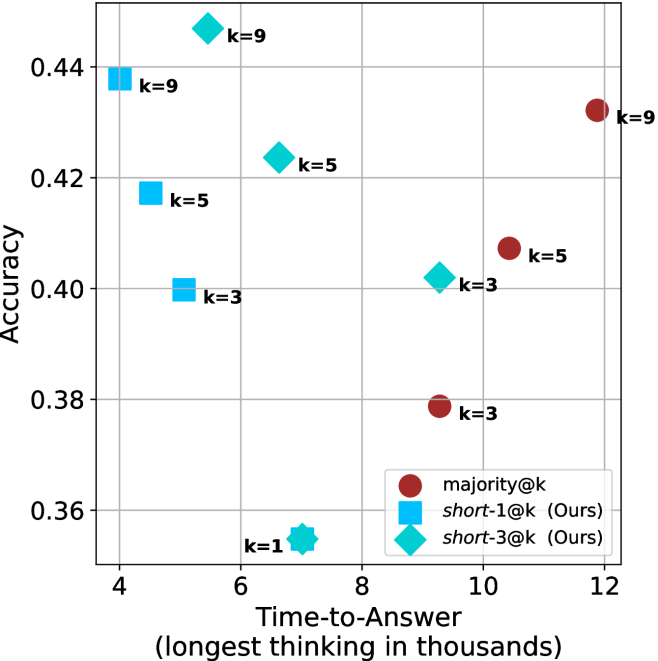
This image presents a scatter plot comparing the accuracy and time-to-answer for different values of 'k' in three different methods: majority@k, short-1@k (labeled "Ours"), and short-3@k (labeled "Ours"). The x-axis represents the time-to-answer in thousands of units, and the y-axis represents the accuracy. Each data point is labeled with the corresponding 'k' value.
### Components/Axes
* **X-axis:** Time-to-Answer (longest thinking in thousands) - Scale ranges from approximately 4 to 12.
* **Y-axis:** Accuracy - Scale ranges from approximately 0.36 to 0.44.
* **Legend:** Located in the bottom-right corner.
* majority@k - Represented by red circles.
* short-1@k (Ours) - Represented by light blue squares.
* short-3@k (Ours) - Represented by teal diamonds.
* **Data Labels:** Each data point is labeled with the value of 'k'.
### Detailed Analysis
The plot shows the relationship between accuracy and time-to-answer for different values of 'k' for each method.
**majority@k (Red Circles):**
* The data points generally trend upwards, indicating that as time-to-answer increases, accuracy also increases.
* k=1: Approximately (8, 0.36)
* k=3: Approximately (9.5, 0.38)
* k=5: Approximately (10.5, 0.41)
* k=9: Approximately (12, 0.43)
**short-1@k (Light Blue Squares):**
* The data points show a relatively flat trend, with accuracy remaining fairly constant as time-to-answer increases.
* k=3: Approximately (4.5, 0.40)
* k=5: Approximately (5, 0.42)
* k=9: Approximately (4, 0.44)
**short-3@k (Teal Diamonds):**
* The data points show an upward trend, but less pronounced than majority@k.
* k=1: Approximately (6, 0.36)
* k=5: Approximately (6.5, 0.42)
* k=9: Approximately (7, 0.44)
### Key Observations
* For lower values of 'k' (1-3), short-1@k and short-3@k generally achieve higher accuracy than majority@k.
* As 'k' increases to 5 and 9, majority@k begins to approach and even surpass the accuracy of short-1@k and short-3@k.
* short-1@k exhibits the most consistent accuracy across different 'k' values, with minimal variation.
* short-3@k shows a more noticeable increase in accuracy as 'k' increases.
### Interpretation
The data suggests a trade-off between accuracy and time-to-answer. The "Ours" methods (short-1@k and short-3@k) prioritize faster response times (lower time-to-answer) at the cost of some accuracy, particularly for smaller values of 'k'. The majority@k method, on the other hand, requires more time to achieve higher accuracy, especially as 'k' increases.
The consistent accuracy of short-1@k indicates that it may be a good choice when a fast response time is critical, even if it means sacrificing some accuracy. The increasing accuracy of short-3@k with larger 'k' suggests that it could be a viable option when a balance between speed and accuracy is desired.
The fact that majority@k eventually surpasses the "Ours" methods at higher 'k' values suggests that, given enough time, a simple majority vote can achieve comparable or even better accuracy. However, the significant time cost associated with majority@k may make it impractical in certain applications.
The 'k' parameter likely represents the number of candidates or options considered during the answer selection process. A higher 'k' value implies a more thorough search, potentially leading to better accuracy but also increased computational cost and time-to-answer.