## Scatter Plot: Accuracy vs. Time-to-Answer for Different Methods
### Overview
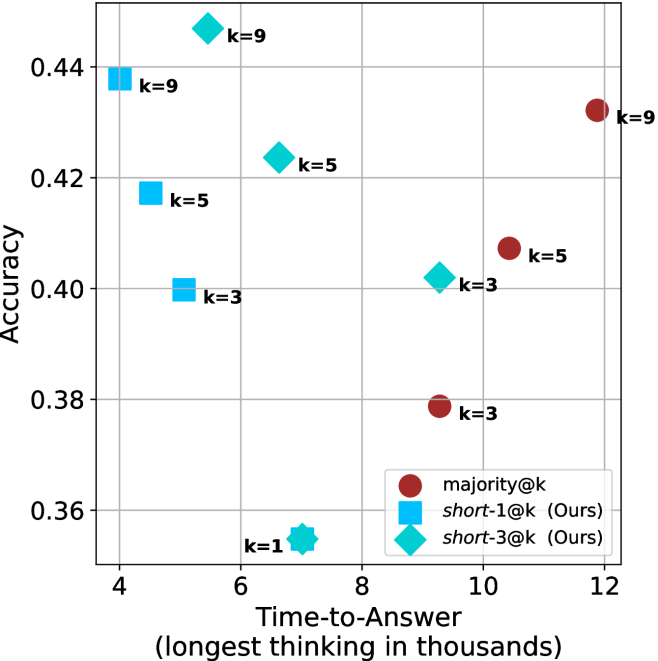
The image is a scatter plot comparing the **Accuracy** of different methods against their **Time-to-Answer** (measured in thousands of seconds). Three distinct methods are represented by colored markers:
- **majority@k** (red circles)
- **short-1@k (Ours)** (blue squares)
- **short-3@k (Ours)** (teal diamonds)
The plot includes labeled data points with specific **k-values** (e.g., k=1, k=3, k=5, k=9) and their corresponding accuracy and time values.
---
### Components/Axes
- **X-axis (Time-to-Answer)**: Labeled "Time-to-Answer (longest thinking in thousands)" with values ranging from 4 to 12.
- **Y-axis (Accuracy)**: Labeled "Accuracy" with values ranging from 0.36 to 0.44.
- **Legend**: Located in the **bottom-right** corner, mapping colors to methods:
- Red circles: **majority@k**
- Blue squares: **short-1@k (Ours)**
- Teal diamonds: **short-3@k (Ours)**
- **Data Points**: Labeled with **k-values** (e.g., "k=9", "k=5", "k=3", "k=1") and positioned at specific (Time, Accuracy) coordinates.
---
### Detailed Analysis
#### Data Points and Trends
1. **majority@k (Red Circles)**:
- **k=9**: (12, 0.43)
- **k=5**: (10, 0.42)
- **k=3**: (8, 0.40)
- **k=1**: (6, 0.38)
- **Trend**: Accuracy decreases slightly as time decreases. Higher **k-values** correlate with longer time and marginally higher accuracy.
2. **short-1@k (Blue Squares)**:
- **k=9**: (4, 0.44)
- **k=5**: (6, 0.42)
- **k=3**: (8, 0.40)
- **Trend**: Accuracy decreases as time increases. Lower **k-values** (e.g., k=9) achieve higher accuracy in shorter time.
3. **short-3@k (Teal Diamonds)**:
- **k=9**: (6, 0.42)
- **k=5**: (8, 0.40)
- **k=3**: (10, 0.38)
- **Trend**: Accuracy decreases as time increases. Similar to short-1@k but with slightly lower accuracy for the same time.
#### Key Observations
- **Outliers**:
- The **teal diamond** at **k=1** (4, 0.36) is an outlier, showing the lowest accuracy (0.36) at the shortest time (4).
- The **red circle** at **k=9** (12, 0.43) is the highest accuracy (0.43) at the longest time (12).
- **Method Comparison**:
- **majority@k** (red) consistently achieves higher accuracy but requires more time.
- **short-1@k** (blue) and **short-3@k** (teal) trade off speed for slightly lower accuracy.
- **short-1@k** (blue) outperforms **short-3@k** (teal) in accuracy for the same time (e.g., k=5: 0.42 vs. 0.40).
---
### Interpretation
The data suggests a trade-off between **accuracy** and **time-to-answer** across methods:
- **majority@k** prioritizes accuracy at the cost of longer processing time, likely due to exhaustive search or deeper reasoning.
- **short-1@k** and **short-3@k** (both labeled "Ours") optimize for speed, sacrificing some accuracy. The **short-1@k** method (blue) appears more efficient than **short-3@k** (teal) for the same time.
- The **k=1** outlier (teal) may indicate a failure mode or edge case where the method underperforms, warranting further investigation.
This plot highlights the importance of balancing computational efficiency and accuracy in decision-making systems, with **short-1@k** emerging as a promising candidate for time-sensitive applications.