## Diagram: Panel Comparison of Shapes and Colors
### Overview
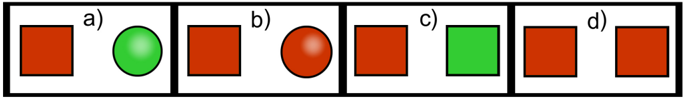
The image displays four horizontally aligned panels labeled **a)**, **b)**, **c)**, and **d)**, each containing a red rectangle paired with a secondary shape. The secondary shapes vary in color (green/red) and form (circle/rectangle). All text and shapes are rendered in flat colors with no gradients or textures.
### Components/Axes
- **Panels**: Labeled **a)**, **b)**, **c)**, **d)** in black text at the top of each panel.
- **Primary Elements**:
- Red rectangles (consistent across all panels).
- Secondary shapes:
- **a)**: Green circle.
- **b)**: Red circle.
- **c)**: Green rectangle.
- **d)**: Red rectangle.
- **Color Coding**:
- Green shapes (a, c) vs. red shapes (b, d).
- Shapes alternate between circles (a, b) and rectangles (c, d).
### Detailed Analysis
1. **Panel a)**:
- Red rectangle (left) paired with a green circle (right).
- Green circle is fully enclosed within the panel’s bounds.
2. **Panel b)**:
- Red rectangle (left) paired with a red circle (right).
- Red circle matches the rectangle’s color but differs in shape.
3. **Panel c)**:
- Red rectangle (left) paired with a green rectangle (right).
- Green rectangle shares the same aspect ratio as the red rectangle.
4. **Panel d)**:
- Two red rectangles (left and right), identical in size and color.
- No secondary shape present.
### Key Observations
- **Color Consistency**: Panels **a** and **c** use green shapes, while **b** and **d** use red shapes.
- **Shape Progression**:
- Circles dominate panels **a** and **b**.
- Rectangles dominate panels **c** and **d**.
- **Repetition**: Panel **d** repeats the red rectangle motif, suggesting a terminal or default state.
### Interpretation
The diagram likely illustrates a categorical comparison or state transition:
1. **Color Significance**:
- Green shapes (a, c) may represent "active" or "positive" states.
- Red shapes (b, d) could denote "inactive" or "negative" states.
2. **Shape Evolution**:
- Transition from circles (a, b) to rectangles (c, d) might symbolize a shift from fluidity to structure.
3. **Panel d’s Duality**:
- Two identical red rectangles could imply redundancy, symmetry, or a finalized state where no further variation exists.
This structure suggests a workflow or decision tree where color and shape encode distinct properties, with panel **d** representing a resolved or standardized outcome.