\n
## Diagram: Shape and Color Combinations
### Overview
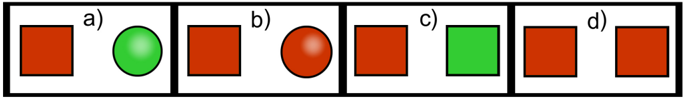
The image presents a sequence of four distinct arrangements, each contained within a black-bordered square. Each arrangement features a red rectangle and a colored circle. The arrangements are labeled a) through d). The purpose appears to be illustrating different combinations of shapes and colors.
### Components/Axes
There are no axes or scales present. The components are:
* Red Rectangle: Present in all four arrangements.
* Green Circle: Present in arrangement a) and c).
* Red Circle: Present in arrangement b).
* No Circle: Present in arrangement d).
* Labels: a), b), c), d) – indicating the order of the arrangements.
### Detailed Analysis or Content Details
* **a)**: Red rectangle positioned on the left, green circle positioned on the right.
* **b)**: Red rectangle positioned on the left, red circle positioned on the right.
* **c)**: Red rectangle positioned on the left, green circle positioned on the right.
* **d)**: Only a red rectangle is present.
### Key Observations
The arrangements demonstrate variations in the presence and color of the circle. Arrangements a) and c) share the same color combination (red rectangle, green circle). Arrangement b) features a red circle, while arrangement d) lacks a circle altogether.
### Interpretation
The diagram likely illustrates a concept related to combinations, selections, or states. The arrangements could represent:
* **Possible outcomes:** The arrangements could represent different possible outcomes of an event.
* **States of a system:** Each arrangement could represent a different state of a system, where the presence or absence of the circle indicates a specific condition.
* **Visual comparison:** The diagram could be used to visually compare different combinations of shapes and colors.
The repetition of the red rectangle suggests it represents a constant or baseline element, while the circle represents a variable element that can be either present (green or red) or absent. The similarity between a) and c) suggests a specific relationship or equivalence between those two states. The diagram does not provide quantitative data, but rather focuses on qualitative differences in arrangement.