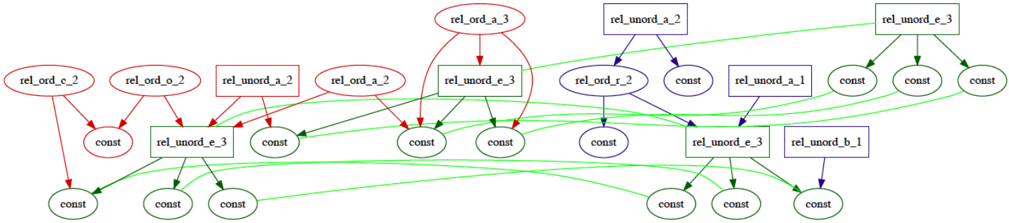
## Diagram: Relational Dependency Graph
### Overview
The image displays a directed graph representing a complex system of relationships, likely a schema or logic dependency map. The diagram consists of nodes (ellipses and rectangles) connected by directed arrows. The nodes are color-coded (Red, Blue, Green), and the arrows are colored to match the destination node. The graph illustrates a hierarchical flow where higher-level relational entities ("rel_...") decompose into lower-level entities and constant values ("const").
### Components/Axes
* **Nodes:**
* **Ellipses:** Represent specific relational entities (e.g., `rel_ord_c_2`) or constant values (`const`).
* **Rectangles:** Represent specific relational entities (e.g., `rel_unord_e_3`).
* **Color Coding:**
* **Red:** Associated with "ordered" relations (`rel_ord_...`) and specific constants.
* **Blue:** Associated with "unordered" relations (`rel_unord_...`) and specific constants.
* **Green:** Associated with "unordered" relations (`rel_unord_e_3`) and terminal constant values.
* **Edges (Arrows):**
* Directed lines indicating the flow of dependency.
* **Crucial Observation:** The color of the arrow matches the color of the *destination* (target) node.
### Detailed Analysis
The graph can be segmented into three primary clusters based on the source node colors:
**1. Red Cluster (Left/Top-Left):**
* `rel_ord_c_2` (red ellipse): Points to `const` (red ellipse) via a red arrow, and `const` (green ellipse) via a green arrow.
* `rel_ord_o_2` (red ellipse): Points to `const` (red ellipse) via a red arrow.
* `rel_unord_a_2` (red rectangle): Points to `rel_unord_e_3` (green rectangle) via a green arrow, and `const` (green ellipse) via a green arrow.
* `rel_ord_a_2` (red ellipse): Points to `rel_unord_e_3` (green rectangle) via a green arrow, and `const` (green ellipse) via a green arrow.
* `rel_ord_a_3` (red ellipse): Points to `rel_unord_e_3` (green rectangle) via a green arrow, and `const` (green ellipse) via a green arrow.
**2. Green Cluster (Central/Bottom):**
* `rel_unord_e_3` (green rectangle, top-center): Points to two `const` (green ellipses) via green arrows.
* `rel_unord_e_3` (green rectangle, top-right): Points to two `const` (green ellipses) via green arrows.
* `rel_unord_e_3` (green rectangle, bottom-right): Points to two `const` (green ellipses) and one `const` (blue ellipse) via green and blue arrows respectively.
**3. Blue Cluster (Right/Top-Right):**
* `rel_unord_a_2` (blue rectangle): Points to `rel_ord_r_2` (blue ellipse) via a blue arrow, and `const` (blue ellipse) via a blue arrow.
* `rel_ord_r_2` (blue ellipse): Points to `const` (blue ellipse) via a blue arrow, and `rel_unord_e_3` (green rectangle, bottom-right) via a green arrow.
* `rel_unord_a_1` (blue rectangle): Points to `rel_unord_e_3` (green rectangle, bottom-right) via a green arrow, and `const` (green ellipse) via a green arrow.
* `rel_unord_b_1` (blue rectangle): Points to `const` (blue ellipse) via a blue arrow.
### Key Observations
* **Centrality of `rel_unord_e_3`:** This specific node appears four times in the diagram, acting as a recurring structural component or template that is instantiated across different branches of the graph.
* **Terminal Nodes:** The `const` nodes are the most frequent, acting as the "leaves" of the tree-like structures.
* **Naming Convention:** The labels distinguish between "ordered" (`rel_ord`) and "unordered" (`rel_unord`) relations, suggesting the diagram models data structures where sequence matters versus those where it does not.
* **Structural Symmetry:** While the graph is complex, there is a clear flow from top-level relational definitions down to base constants.
### Interpretation
This diagram appears to be a **dependency graph or a schema definition** for a formal system, such as a database query plan, a logic programming language (like Datalog), or a compiler's intermediate representation.
* **Modularity:** The repetition of `rel_unord_e_3` suggests that the system utilizes a modular design where specific relational patterns are reused.
* **Logic Flow:** The distinction between `rel_ord` and `rel_unord` implies the system handles two distinct types of data processing: one that respects the order of elements and one that treats elements as a set (unordered).
* **Color Logic:** The color-coding of arrows to match the target node suggests that the system might be tracking "type safety" or "data provenance," where the color represents the type of the resulting node, and the arrow color confirms that the relationship is valid for that specific type.