## Diagram: Relationship Diagram of Entities
### Overview
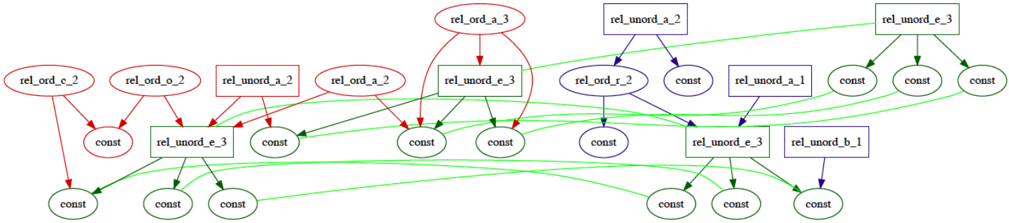
The image is a relationship diagram depicting connections between different entities labeled with prefixes "rel_ord_", "rel_unord_", and "const". The diagram uses colored lines (red, blue, green) to represent relationships between these entities. The shapes of the nodes (rectangles, ovals) also seem to carry meaning.
### Components/Axes
* **Nodes:**
* Rectangles: Represent entities with the prefix "rel_unord_".
* Ovals: Represent entities with the prefixes "rel_ord_" and "const".
* **Edges (Connections):**
* Red Arrows: Connect "rel_ord_" entities to "const" entities and "rel_unord_" entities.
* Blue Arrows: Connect "rel_unord_" entities to "const" entities and "rel_unord_" entities.
* Green Arrows: Connect "rel_unord_" entities to "const" entities.
* **Labels:**
* `rel_ord_c_2` (Red oval, top-left)
* `rel_ord_o_2` (Red oval, top-left)
* `rel_unord_a_2` (Red rectangle, top-center)
* `rel_ord_a_2` (Red oval, top-center)
* `rel_ord_a_3` (Red oval, top-center)
* `rel_unord_e_3` (Green rectangle, top-center)
* `rel_ord_r_2` (Blue oval, center)
* `rel_unord_a_2` (Blue rectangle, center)
* `rel_unord_a_1` (Blue rectangle, center)
* `rel_unord_e_3` (Green rectangle, center)
* `rel_unord_e_3` (Green rectangle, bottom)
* `rel_unord_b_1` (Blue rectangle, bottom)
* `const` (Green ovals, bottom row, and scattered throughout)
### Detailed Analysis or Content Details
* **Top Row (Left to Right):**
* `rel_ord_c_2` (Red oval) connects to a `const` (Green oval) below it with a red arrow. This `const` then connects to another `const` (Green oval) at the bottom with a green arrow.
* `rel_ord_o_2` (Red oval) connects to a `const` (Green oval) below it with a red arrow. This `const` then connects to another `const` (Green oval) at the bottom with a green arrow.
* `rel_unord_a_2` (Red rectangle) connects to a `const` (Green oval) below it with a red arrow. This `const` then connects to another `const` (Green oval) at the bottom with a green arrow.
* `rel_ord_a_2` (Red oval) connects to a `const` (Green oval) below it with a red arrow. This `const` then connects to another `const` (Green oval) at the bottom with a green arrow.
* `rel_ord_a_3` (Red oval) connects to a `const` (Green oval) below it with a red arrow. This `const` then connects to another `const` (Green oval) at the bottom with a green arrow.
* `rel_unord_e_3` (Green rectangle) connects to three `const` (Green ovals) below it with green arrows. These `const` ovals are in the bottom row.
* **Middle Row (Left to Right):**
* `rel_ord_r_2` (Blue oval) connects to a `const` (Blue oval) below it with a blue arrow. This `const` then connects to another `const` (Green oval) at the bottom with a green arrow.
* `rel_unord_a_2` (Blue rectangle) connects to a `const` (Blue oval) below it with a blue arrow. This `const` then connects to another `const` (Green oval) at the bottom with a green arrow.
* `rel_unord_a_1` (Blue rectangle) connects to a `const` (Blue oval) below it with a blue arrow. This `const` then connects to another `const` (Green oval) at the bottom with a green arrow.
* `rel_unord_e_3` (Green rectangle) connects to three `const` (Green ovals) below it with green arrows. These `const` ovals are in the bottom row.
* **Bottom Row:**
* `rel_unord_b_1` (Blue rectangle) connects to a `const` (Blue oval) below it with a blue arrow.
### Key Observations
* Entities prefixed with "rel_ord_" are represented by red ovals.
* Entities prefixed with "rel_unord_" are represented by rectangles (red, blue, or green).
* "const" entities are represented by green ovals, except when directly connected to a "rel_ord_" or "rel_unord_" entity, in which case they are the same color as the connecting arrow.
* All entities eventually connect to a "const" entity in the bottom row.
* "rel_unord_e_3" is a central node, connecting to multiple "const" entities.
### Interpretation
The diagram illustrates relationships between different types of entities, possibly representing data dependencies or a hierarchical structure. The "rel_ord_" entities might represent ordered relations, while "rel_unord_" entities represent unordered relations. The "const" entities likely represent constant values or terminal nodes in the graph. The colors and shapes of the nodes and edges likely encode additional information about the nature of these relationships. The diagram suggests a flow of information or dependency from the top-level entities down to the "const" entities at the bottom. The central role of "rel_unord_e_3" suggests it is a key component in this system.