\n
## Diagram: Dependency Graph
### Overview
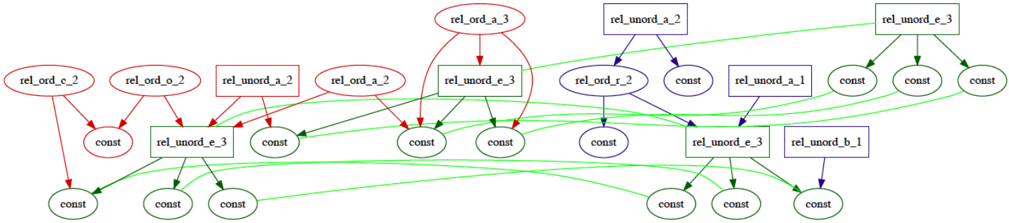
The image depicts a directed graph representing dependencies between various elements labeled with strings like "rel_ord_c_2" and "const". The nodes are connected by directed edges (arrows) indicating the direction of dependency. The graph appears to be structured in a roughly horizontal layout, with multiple levels of nodes and connections.
### Components/Axes
The diagram consists of nodes (circles or ovals) and directed edges (arrows). The nodes are labeled with strings. There are no explicit axes or scales. The nodes can be categorized as follows:
* **"const"**: Represents a constant or base element. These appear frequently throughout the graph.
* **"rel_ord_*"**: Nodes starting with "rel_ord_" likely represent relational ordered elements.
* **"rel_unord_*"**: Nodes starting with "rel_unord_" likely represent relational unordered elements.
The edges are colored:
* **Red**: Indicates a dependency relationship.
* **Green**: Indicates a dependency relationship.
* **Black**: Indicates a dependency relationship.
### Detailed Analysis or Content Details
The diagram can be broken down into sections, reading from left to right:
**Leftmost Section:**
* `rel_ord_c_2` depends on three `const` nodes (bottom row).
* `rel_unord_e_3` depends on three `const` nodes (bottom row).
* `rel_ord_o_2` depends on `rel_unord_e_3`.
* `rel_unord_a_2` depends on `rel_unord_e_3`.
* `rel_unord_e_2` depends on `rel_unord_a_2`.
* `rel_unord_e_3` depends on `rel_unord_e_2`.
* `rel_ord_a_3` depends on `rel_unord_e_3`.
**Middle Section:**
* `rel_ord_r_2` depends on `const`.
* `rel_unord_a_1` depends on `const`.
* `rel_unord_e_3` depends on `rel_ord_r_2` and `rel_unord_a_1`.
**Rightmost Section:**
* `rel_unord_e_3` depends on `const`.
* `rel_unord_b_1` depends on `const`.
* `rel_unord_e_3` depends on `rel_unord_b_1`.
**Connections:**
* Multiple nodes depend on the `const` nodes at the bottom.
* `rel_ord_a_3` is the highest-level node in the leftmost section.
* `rel_unord_e_3` appears multiple times and acts as a central dependency point.
### Key Observations
* The "const" nodes are foundational, serving as inputs for many other elements.
* `rel_unord_e_3` is a highly connected node, indicating its importance in the overall dependency structure.
* The graph is not symmetrical; dependencies flow in specific directions.
* The use of different colors for the edges doesn't seem to indicate a specific type of dependency, but rather a visual distinction.
### Interpretation
This diagram likely represents a computational or logical dependency graph. The nodes represent operations, variables, or data elements, and the edges represent the flow of data or control. The "const" nodes likely represent fixed values or initial conditions. The "rel_ord_" and "rel_unord_" nodes suggest relationships that may be ordered or unordered, respectively.
The graph demonstrates a hierarchical structure where higher-level elements depend on lower-level elements. The repeated use of `rel_unord_e_3` suggests it's a crucial intermediate result or operation. The diagram could be used to visualize the execution order of a program, the dependencies between modules in a software system, or the relationships between variables in a mathematical model.
Without further context, it's difficult to determine the precise meaning of the labels. However, the diagram provides a clear visual representation of the dependencies between these elements. The diagram suggests a complex system with multiple interconnected components, where the "const" nodes form the base and the higher-level nodes build upon them. The presence of both ordered and unordered relationships indicates a potentially diverse set of dependencies.