## Flow Diagram: API Call Processing for LM Dataset
### Overview
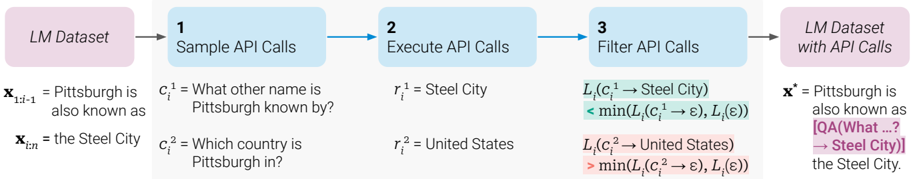
The image is a flow diagram illustrating a three-step process for incorporating API calls into a Language Model (LM) dataset. The process starts with an initial LM dataset, proceeds through sampling, executing, and filtering API calls, and culminates in an enriched LM dataset with API calls.
### Components/Axes
* **Nodes:** The diagram consists of four rounded rectangular nodes, each representing a stage in the process. The first and last nodes are colored light purple, while the middle two are light blue.
* **Arrows:** Blue arrows indicate the flow of data and operations between the nodes.
* **Text Labels:** Each node contains a text label describing its function.
* **Mathematical Expressions:** Below each of the middle nodes are mathematical expressions that describe the operations being performed.
### Detailed Analysis or ### Content Details
**Node 1 (Leftmost):**
* Label: "LM Dataset"
* Color: Light Purple
* Input Data Example:
* x<sub>1:i-1</sub> = Pittsburgh is also known as
* x<sub>i:n</sub> = the Steel City
**Node 2:**
* Label: "1 Sample API Calls"
* Color: Light Blue
* API Call Examples:
* c<sub>i</sub><sup>1</sup> = What other name is Pittsburgh known by?
* c<sub>i</sub><sup>2</sup> = Which country is Pittsburgh in?
**Node 3:**
* Label: "2 Execute API Calls"
* Color: Light Blue
* API Call Results:
* r<sub>i</sub><sup>1</sup> = Steel City
* r<sub>i</sub><sup>2</sup> = United States
**Node 4:**
* Label: "3 Filter API Calls"
* Color: Light Blue
* Filtering Logic:
* L<sub>i</sub>(c<sub>i</sub><sup>1</sup> → Steel City) < min(L<sub>i</sub>(c<sub>i</sub><sup>1</sup> → ε), L<sub>i</sub>(ε))
* The likelihood of the API call 1 resulting in "Steel City" is less than the minimum of the likelihood of the API call 1 resulting in nothing, and the likelihood of nothing. The "<" is colored green.
* L<sub>i</sub>(c<sub>i</sub><sup>2</sup> → United States) > min(L<sub>i</sub>(c<sub>i</sub><sup>2</sup> → ε), L<sub>i</sub>(ε))
* The likelihood of the API call 2 resulting in "United States" is greater than the minimum of the likelihood of the API call 2 resulting in nothing, and the likelihood of nothing. The ">" is colored red.
**Node 5 (Rightmost):**
* Label: "LM Dataset with API Calls"
* Color: Light Purple
* Output Data Example:
* x* = Pittsburgh is also known as [QA(What ...? → Steel City)] the Steel City.
### Key Observations
* The diagram illustrates a pipeline for augmenting a language model dataset with information obtained through API calls.
* The filtering step uses likelihood comparisons to determine which API calls and their results are incorporated into the final dataset.
* The mathematical expressions provide a formal representation of the filtering criteria.
### Interpretation
The diagram describes a method for enhancing a language model's knowledge by integrating external information retrieved via API calls. The process involves sampling potential API calls based on the existing dataset, executing those calls to obtain results, and then filtering the results based on a likelihood comparison. This filtering step is crucial for ensuring that only relevant and reliable information is added to the language model's training data. The use of likelihoods suggests a probabilistic approach to assessing the quality and relevance of the API call results. The final dataset, "LM Dataset with API Calls," represents an enriched version of the original dataset, potentially leading to improved performance of the language model on tasks requiring external knowledge.