\n
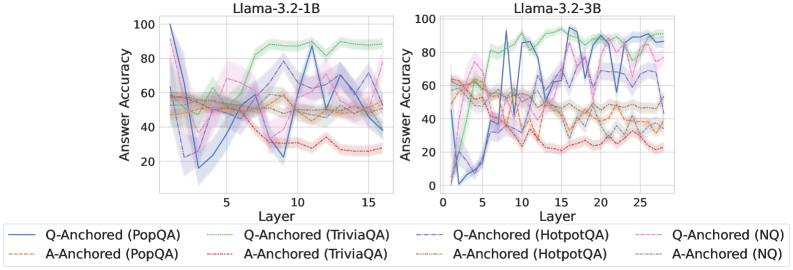
## Line Chart: Answer Accuracy vs. Layer for Llama Models
### Overview
The image presents two line charts comparing the answer accuracy of different question-answering datasets (PopQA, TriviaQA, HotpotQA, and NQ) across layers of two Llama models: Llama-3.2-1B and Llama-3.2-3B. Each chart displays the accuracy of both Q-Anchored and A-Anchored approaches for each dataset. The charts use shaded areas to represent the variance around the mean accuracy.
### Components/Axes
* **X-axis:** Layer (ranging from approximately 1 to 15 for the 1B model and 1 to 25 for the 3B model).
* **Y-axis:** Answer Accuracy (ranging from 0 to 100).
* **Left Chart Title:** Llama-3.2-1B
* **Right Chart Title:** Llama-3.2-3B
* **Legend:** Located at the bottom of the image.
* Blue Line: Q-Anchored (PopQA)
* Orange Line: A-Anchored (PopQA)
* Purple Line: Q-Anchored (TriviaQA)
* Light Blue Line: A-Anchored (TriviaQA)
* Red Dashed Line: Q-Anchored (HotpotQA)
* Brown Line: A-Anchored (HotpotQA)
* Green Line: Q-Anchored (NQ)
* Light Green Line: A-Anchored (NQ)
### Detailed Analysis or Content Details
**Llama-3.2-1B Chart (Left)**
* **Q-Anchored (PopQA) - Blue Line:** Starts at approximately 95% accuracy at layer 1, rapidly decreases to around 20% by layer 3, then fluctuates between 30% and 60% for the remaining layers.
* **A-Anchored (PopQA) - Orange Line:** Starts at approximately 55% accuracy at layer 1, decreases to around 40% by layer 3, and remains relatively stable between 40% and 60% for the rest of the layers.
* **Q-Anchored (TriviaQA) - Purple Line:** Starts at approximately 60% accuracy at layer 1, increases to around 80% by layer 5, then fluctuates between 60% and 90% for the remaining layers.
* **A-Anchored (TriviaQA) - Light Blue Line:** Starts at approximately 45% accuracy at layer 1, increases to around 60% by layer 5, and remains relatively stable between 40% and 70% for the rest of the layers.
* **Q-Anchored (HotpotQA) - Red Dashed Line:** Starts at approximately 40% accuracy at layer 1, fluctuates significantly between 20% and 70% for the rest of the layers.
* **A-Anchored (HotpotQA) - Brown Line:** Starts at approximately 30% accuracy at layer 1, fluctuates significantly between 20% and 50% for the rest of the layers.
* **Q-Anchored (NQ) - Green Line:** Starts at approximately 65% accuracy at layer 1, increases to around 90% by layer 5, then fluctuates between 70% and 95% for the remaining layers.
* **A-Anchored (NQ) - Light Green Line:** Starts at approximately 35% accuracy at layer 1, increases to around 50% by layer 5, and remains relatively stable between 30% and 60% for the rest of the layers.
**Llama-3.2-3B Chart (Right)**
* **Q-Anchored (PopQA) - Blue Line:** Starts at approximately 85% accuracy at layer 1, decreases to around 30% by layer 5, then fluctuates between 40% and 70% for the remaining layers.
* **A-Anchored (PopQA) - Orange Line:** Starts at approximately 60% accuracy at layer 1, decreases to around 40% by layer 5, and remains relatively stable between 40% and 60% for the rest of the layers.
* **Q-Anchored (TriviaQA) - Purple Line:** Starts at approximately 80% accuracy at layer 1, increases to around 95% by layer 5, then fluctuates between 70% and 90% for the remaining layers.
* **A-Anchored (TriviaQA) - Light Blue Line:** Starts at approximately 50% accuracy at layer 1, increases to around 70% by layer 5, and remains relatively stable between 50% and 80% for the rest of the layers.
* **Q-Anchored (HotpotQA) - Red Dashed Line:** Starts at approximately 50% accuracy at layer 1, fluctuates significantly between 30% and 80% for the rest of the layers.
* **A-Anchored (HotpotQA) - Brown Line:** Starts at approximately 40% accuracy at layer 1, fluctuates significantly between 20% and 60% for the rest of the layers.
* **Q-Anchored (NQ) - Green Line:** Starts at approximately 75% accuracy at layer 1, increases to around 90% by layer 5, then fluctuates between 70% and 95% for the remaining layers.
* **A-Anchored (NQ) - Light Green Line:** Starts at approximately 40% accuracy at layer 1, increases to around 60% by layer 5, and remains relatively stable between 40% and 70% for the rest of the layers.
### Key Observations
* The 3B model generally exhibits higher initial accuracy across all datasets compared to the 1B model.
* The Q-Anchored approach consistently outperforms the A-Anchored approach for most datasets, particularly for TriviaQA and NQ.
* HotpotQA shows the most significant fluctuations in accuracy for both models and both anchoring methods.
* PopQA shows a sharp initial drop in accuracy for both models, followed by stabilization.
* The shaded areas indicate a considerable variance in accuracy, suggesting that the performance is not consistently stable across different samples or runs.
### Interpretation
The charts demonstrate the impact of model size (1B vs. 3B) and anchoring method (Q vs. A) on answer accuracy across different question-answering datasets. The larger 3B model generally performs better, indicating that increased model capacity leads to improved performance. The Q-Anchored approach, which likely focuses on question-based reasoning, consistently yields higher accuracy than the A-Anchored approach, suggesting that question understanding is crucial for accurate answers. The high variability in accuracy, as indicated by the shaded areas, highlights the challenges in achieving consistent performance in question answering and the need for further research to improve model robustness. The erratic behavior of HotpotQA suggests that this dataset is particularly challenging for the models, potentially due to its complex reasoning requirements. The initial drop in PopQA accuracy could be attributed to the model needing to adapt to the specific characteristics of this dataset. Overall, the data suggests that while larger models and question-focused anchoring improve performance, there is still significant room for improvement in question-answering systems.