TECHNICAL ASSET FINGERPRINT
7838d3d9b0f7bb1f93bc7086
Click to view fullscreen
Press ESC or click to close
FOUND IN PAPERS
EXPERT: healer-alpha-free VERSION 1
RUNTIME: free/openrouter/healer-alpha
INTEL_VERIFIED
## Line Charts: Llama-3.2 Model Layer-wise Answer Accuracy
### Overview
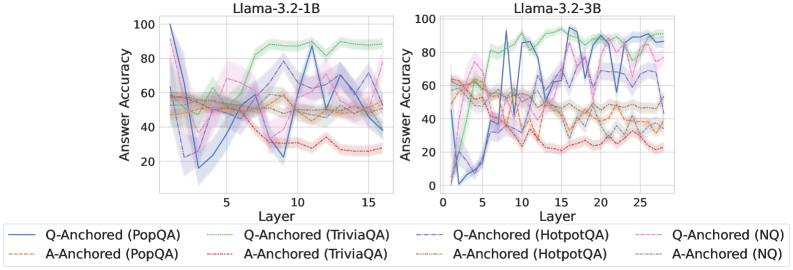
The image displays two side-by-side line charts comparing the "Answer Accuracy" across different layers of two language models: **Llama-3.2-1B** (left) and **Llama-3.2-3B** (right). Each chart plots the performance of eight different experimental conditions, defined by an anchoring method (Q-Anchored or A-Anchored) applied to four distinct question-answering datasets (PopQA, TriviaQA, HotpotQA, NQ).
### Components/Axes
* **Titles:**
* Left Chart: `Llama-3.2-1B`
* Right Chart: `Llama-3.2-3B`
* **Y-Axis (Both Charts):**
* Label: `Answer Accuracy`
* Scale: 0 to 100, with major tick marks at 0, 20, 40, 60, 80, 100.
* **X-Axis (Both Charts):**
* Label: `Layer`
* Scale (Llama-3.2-1B): 0 to 15, with major tick marks at 5, 10, 15.
* Scale (Llama-3.2-3B): 0 to 25, with major tick marks at 5, 10, 15, 20, 25.
* **Legend (Bottom, spanning both charts):**
* Positioned below the x-axes of both charts.
* Contains 8 entries, each with a unique line style/color and label:
1. `Q-Anchored (PopQA)` - Solid blue line.
2. `Q-Anchored (TriviaQA)` - Solid green line.
3. `Q-Anchored (HotpotQA)` - Dashed purple line.
4. `Q-Anchored (NQ)` - Dotted pink line.
5. `A-Anchored (PopQA)` - Dash-dot orange line.
6. `A-Anchored (TriviaQA)` - Dash-dot red line.
7. `A-Anchored (HotpotQA)` - Dash-dot-dot gray line.
8. `A-Anchored (NQ)` - Dash-dot-dot brown line.
### Detailed Analysis
**Llama-3.2-1B Chart (Left):**
* **General Trend:** Most lines show significant fluctuation across layers, with no single, smooth monotonic trend for any condition.
* **Q-Anchored (TriviaQA) - Solid Green:** This is the top-performing line for most layers after layer 5. It starts around 50% accuracy, rises sharply to a peak of ~90% near layer 10, and remains high (between 80-90%) through layer 15.
* **Q-Anchored (PopQA) - Solid Blue:** Shows extreme volatility. It starts very high (~100% at layer 1), plummets to ~15% by layer 3, recovers to ~90% near layer 11, and ends around 40% at layer 15.
* **A-Anchored Lines (Orange, Red, Gray, Brown):** These lines are generally clustered in the lower half of the chart (20-60% accuracy). They exhibit less extreme volatility than the Q-Anchored PopQA line but still fluctuate considerably. The A-Anchored (TriviaQA) - Red line trends downward from ~60% to ~25%.
* **Q-Anchored (HotpotQA) - Dashed Purple & Q-Anchored (NQ) - Dotted Pink:** These lines occupy the middle range (40-80%), with the HotpotQA line generally above the NQ line. Both show a general, noisy upward trend from layer 1 to layer 15.
**Llama-3.2-3B Chart (Right):**
* **General Trend:** Similar high volatility is present, but the performance spread between the best and worst conditions appears wider, and the peak accuracies are higher.
* **Q-Anchored (TriviaQA) - Solid Green:** Again a top performer. It starts near 60%, climbs to a peak of ~95% around layer 15, and maintains >90% accuracy through layer 25.
* **Q-Anchored (PopQA) - Solid Blue:** Extremely volatile. It starts near 0%, spikes to ~90% by layer 5, drops to ~40%, then oscillates wildly between 40-95% for the remaining layers.
* **Q-Anchored (HotpotQA) - Dashed Purple:** Shows a strong, noisy upward trend, starting near 40% and reaching peaks above 90% in later layers (20-25).
* **A-Anchored Lines:** The A-Anchored (TriviaQA) - Red line shows a clear downward trend from ~60% to ~20%. The other A-Anchored lines (PopQA-Orange, HotpotQA-Gray, NQ-Brown) are clustered between 20-60%, showing moderate fluctuation without a strong directional trend.
### Key Observations
1. **Dataset Performance Hierarchy:** Across both models, the **TriviaQA** dataset (green and red lines) consistently yields the highest accuracy when using Q-Anchoring and the lowest when using A-Anchoring. This suggests TriviaQA is highly sensitive to the anchoring method.
2. **Anchoring Method Impact:** **Q-Anchoring** (solid/dashed/dotted lines) generally leads to higher peak accuracy and greater volatility compared to **A-Anchoring** (dash-dot lines), which produces more stable but lower performance.
3. **Model Size Effect:** The larger **Llama-3.2-3B** model achieves higher peak accuracies (near 95%) compared to the 1B model (near 90%) and sustains high performance for the best conditions (Q-Anchored TriviaQA) across more layers.
4. **Layer-wise Volatility:** Accuracy does not improve smoothly with depth. Instead, it exhibits sharp peaks and troughs, indicating that specific layers are specialized for certain types of knowledge or reasoning tasks related to the datasets.
5. **PopQA Anomaly:** The Q-Anchored PopQA condition (solid blue) is an outlier in its extreme volatility, especially in the 1B model, suggesting the model's handling of this dataset is highly unstable across layers.
### Interpretation
This data visualizes the internal "knowledge localization" within Llama-3.2 models. The key finding is that **factual knowledge is not stored uniformly across the model's layers**. Instead, specific layers become "experts" for specific datasets, and this expertise is dramatically unlocked or suppressed by the prompting strategy (Q-Anchoring vs. A-Anchoring).
* **Q-Anchoring** likely activates a more direct, question-focused retrieval pathway, leading to high but brittle performance concentrated in specific layers. The extreme volatility of the PopQA line suggests its knowledge is particularly fragmented.
* **A-Anchoring** may engage a more generalized, answer-generation pathway, resulting in more stable but sub-optimal performance across layers.
* The **downward trend of A-Anchored TriviaQA** is particularly notable. It suggests that as information propagates through the network, the model's ability to generate the correct answer *without* the question prompt degrades, implying the knowledge is tightly coupled to the question context.
* The **superior and sustained performance of Q-Anchored TriviaQA** in the larger model indicates that scaling model size may improve the robustness and consolidation of knowledge for certain tasks when the correct prompting strategy is used.
In essence, the charts argue that understanding a model's capabilities requires probing its internal layer-wise structure and that performance is a complex interaction between model scale, dataset nature, and prompting technique.
DECODING INTELLIGENCE...