## Line Graph: Answer Accuracy Across Layers for Llama-3.2 Models
### Overview
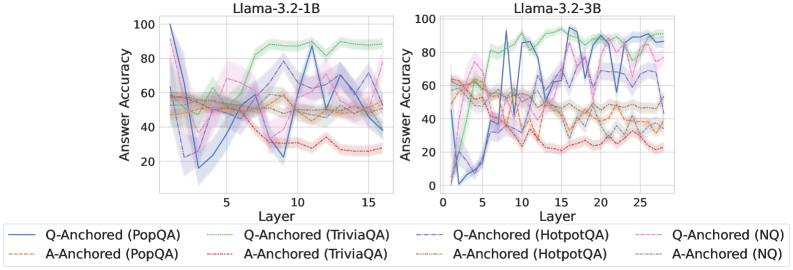
The image contains two side-by-side line graphs comparing answer accuracy across transformer model layers for two Llama-3.2 variants (1B and 3B parameter sizes). Each graph shows multiple data series representing different question-answering datasets and anchoring methods. The graphs use color-coded lines with shaded confidence intervals to visualize performance trends.
### Components/Axes
- **X-axis (Layer)**:
- Left chart: 0–15 (Llama-3.2-1B)
- Right chart: 0–25 (Llama-3.2-3B)
- **Y-axis (Answer Accuracy)**: 0–100% scale
- **Legends**:
- Positioned at bottom of both charts
- Line styles/colors:
- Solid blue: Q-Anchored (PopQA)
- Dashed orange: A-Anchored (PopQA)
- Solid green: Q-Anchored (TriviaQA)
- Dashed red: A-Anchored (TriviaQA)
- Solid purple: Q-Anchored (HotpotQA)
- Dashed gray: A-Anchored (HotpotQA)
- Solid pink: Q-Anchored (NQ)
- Dashed brown: A-Anchored (NQ)
### Detailed Analysis
#### Llama-3.2-1B (Left Chart)
- **Q-Anchored (PopQA)**: Starts at ~90% accuracy (layer 0), dips to ~60% by layer 5, then fluctuates between 50–70%.
- **A-Anchored (PopQA)**: Starts at ~60%, remains relatively stable (50–65%) with minor dips.
- **Q-Anchored (TriviaQA)**: Peaks at ~80% (layer 0), drops sharply to ~40% by layer 5, then stabilizes at 50–60%.
- **A-Anchored (TriviaQA)**: Starts at ~50%, declines to ~30% by layer 5, then fluctuates between 25–40%.
- **Q-Anchored (HotpotQA)**: Begins at ~70%, drops to ~50% by layer 5, then stabilizes at 40–60%.
- **A-Anchored (HotpotQA)**: Starts at ~55%, declines to ~40% by layer 5, then fluctuates between 30–50%.
- **Q-Anchored (NQ)**: Starts at ~65%, dips to ~50% by layer 5, then stabilizes at 45–60%.
- **A-Anchored (NQ)**: Starts at ~50%, declines to ~35% by layer 5, then fluctuates between 30–45%.
#### Llama-3.2-3B (Right Chart)
- **Q-Anchored (PopQA)**: Starts at ~85%, dips to ~60% by layer 5, then fluctuates between 50–75%.
- **A-Anchored (PopQA)**: Starts at ~65%, remains stable (50–70%) with minor dips.
- **Q-Anchored (TriviaQA)**: Peaks at ~80% (layer 0), drops to ~50% by layer 5, then stabilizes at 50–70%.
- **A-Anchored (TriviaQA)**: Starts at ~55%, declines to ~40% by layer 5, then fluctuates between 35–55%.
- **Q-Anchored (HotpotQA)**: Begins at ~75%, drops to ~60% by layer 5, then stabilizes at 50–70%.
- **A-Anchored (HotpotQA)**: Starts at ~60%, declines to ~45% by layer 5, then fluctuates between 40–60%.
- **Q-Anchored (NQ)**: Starts at ~70%, dips to ~60% by layer 5, then stabilizes at 55–70%.
- **A-Anchored (NQ)**: Starts at ~55%, declines to ~40% by layer 5, then fluctuates between 35–55%.
### Key Observations
1. **Model Size Impact**: The 3B model (right chart) shows more pronounced fluctuations in early layers (0–5) but stabilizes better in later layers (15–25) compared to the 1B model.
2. **Q vs. A Anchoring**: Q-anchored methods consistently outperform A-anchored across all datasets and models, with Q-anchored accuracy often 10–20% higher.
3. **Dataset Variability**:
- PopQA shows the most stable performance (lowest variance).
- HotpotQA exhibits the sharpest early-layer drops, particularly in the 3B model.
4. **Confidence Intervals**: Shaded regions indicate ~10–15% variability in accuracy measurements across runs.
### Interpretation
The data suggests that Q-anchored methods (using question context) generally outperform A-anchored methods (using answer context) across all datasets and model sizes. The 3B model demonstrates better layer-wise generalization, with accuracy stabilizing at higher layers (15–25) compared to the 1B model. Notably, the HotpotQA dataset shows the most dramatic early-layer performance drops, suggesting it may be more sensitive to model architecture or training dynamics. The consistent Q-anchored advantage implies that question context is more critical than answer context for these models' reasoning capabilities. The extended layer range in the 3B model (up to 25) reveals that larger models maintain performance in deeper layers, whereas the 1B model's performance degrades more sharply in later layers.