TECHNICAL ASSET FINGERPRINT
785241960937d14ad0499c1a
Click to view fullscreen
Press ESC or click to close
FOUND IN PAPERS
EXPERT: healer-alpha-free VERSION 1
RUNTIME: free/openrouter/healer-alpha
INTEL_VERIFIED
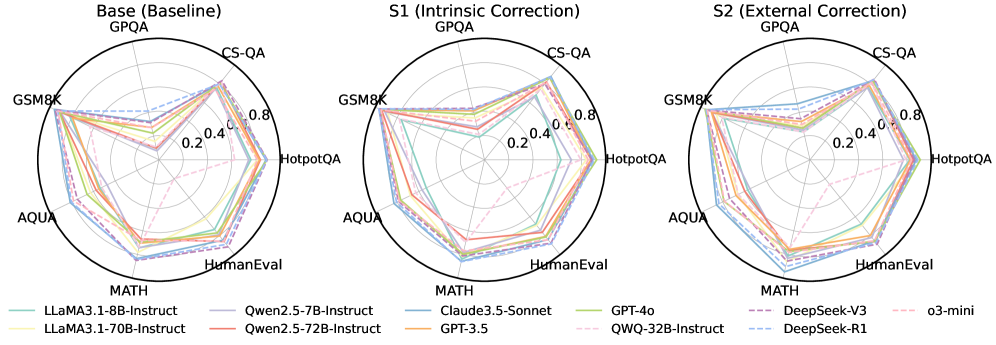
## Radar Chart Comparison: AI Model Performance Across Benchmarks
### Overview
The image displays three radar charts (spider plots) comparing the performance of 11 different large language models (LLMs) across six standardized benchmarks. The charts are organized to show performance under three different conditions: a baseline ("Base"), an "Intrinsic Correction" condition ("S1"), and an "External Correction" condition ("S2"). Each chart plots the same set of models on the same six axes, allowing for a direct visual comparison of how model performance changes across the three conditions.
### Components/Axes
* **Chart Titles (Top Center):**
* Left Chart: `Base (Baseline)`
* Middle Chart: `S1 (Intrinsic Correction)`
* Right Chart: `S2 (External Correction)`
* **Axes (Radial Spokes):** Six benchmarks are plotted as axes radiating from the center. The axes are labeled at their outer ends. Clockwise from the top:
1. `GPQA`
2. `CS-QA`
3. `HotpotQA`
4. `HumanEval`
5. `MATH`
6. `AQUA`
* **Scale (Concentric Circles):** The radial scale is marked by concentric circles representing performance scores. The innermost circle is labeled `0.2`, the next `0.4`, the next `0.6`, and the outermost labeled `0.8`. The center point represents a score of 0.
* **Legend (Bottom):** A comprehensive legend is provided below the three charts, mapping line colors and styles to specific AI models. The legend is organized in three columns.
* **Column 1:**
* `LLaMA3.1-8B-Instruct` (Solid, light teal line)
* `LLaMA3.1-70B-Instruct` (Solid, light yellow-green line)
* **Column 2:**
* `Qwen2.5-7B-Instruct` (Solid, light purple line)
* `Qwen2.5-72B-Instruct` (Solid, salmon pink line)
* **Column 3:**
* `Claude3.5-Sonnet` (Solid, medium blue line)
* `GPT-3.5` (Solid, orange line)
* **Column 4:**
* `GPT-4o` (Solid, light green line)
* `QWQ-32B-Instruct` (Dashed, pink line)
* **Column 5:**
* `DeepSeek-V3` (Dashed, purple line)
* `DeepSeek-R1` (Dashed, light blue line)
* **Column 6:**
* `o3-mini` (Dashed, light pink line)
### Detailed Analysis
**1. Base (Baseline) Chart:**
* **Trend:** Most models show a similar, somewhat irregular pentagonal shape, indicating varied performance across benchmarks. Performance is generally strongest on `GPQA` and `CS-QA` (closer to the 0.8 ring) and weakest on `MATH` and `AQUA` (often between 0.4 and 0.6).
* **Key Data Points (Approximate):**
* **Top Performers (Outermost lines):** `Claude3.5-Sonnet` (blue) and `GPT-4o` (green) consistently form the outermost shape, indicating the highest overall scores. They approach or exceed 0.8 on `GPQA` and `CS-QA`.
* **Mid-Tier:** `Qwen2.5-72B-Instruct` (salmon), `LLaMA3.1-70B-Instruct` (yellow-green), and `GPT-3.5` (orange) form a cluster just inside the top performers.
* **Lower-Tier:** `LLaMA3.1-8B-Instruct` (teal) and `Qwen2.5-7B-Instruct` (purple) are generally the innermost lines, indicating lower scores, particularly on `MATH` and `AQUA` where they dip near or below 0.4.
* **Notable Outlier:** The dashed pink line for `QWQ-32B-Instruct` shows a very distinct shape. It has a pronounced spike towards `HotpotQA` (near 0.8) but is the innermost line on `MATH` and `AQUA` (below 0.4), indicating highly specialized performance.
**2. S1 (Intrinsic Correction) Chart:**
* **Trend:** The overall shapes expand outward compared to the Base chart, suggesting a general improvement in scores across most models and benchmarks after intrinsic correction. The relative ordering of models remains similar.
* **Key Changes:**
* The gap between the top performers (`Claude3.5-Sonnet`, `GPT-4o`) and the mid-tier narrows slightly.
* The lower-tier models (`LLaMA3.1-8B-Instruct`, `Qwen2.5-7B-Instruct`) show noticeable improvement, moving further from the center.
* The specialized shape of `QWQ-32B-Instruct` (dashed pink) becomes less extreme; its low scores on `MATH`/`AQUA` improve, while its high score on `HotpotQA` remains strong.
**3. S2 (External Correction) Chart:**
* **Trend:** This chart shows the most significant expansion and convergence of shapes. The performance of nearly all models improves further, and the differences between them become much smaller. The lines are tightly clustered near the outer edge of the chart.
* **Key Changes:**
* **Massive Convergence:** Almost all models now score between approximately 0.7 and 0.9 on all six benchmarks. The distinct performance profiles seen in the Base chart are largely erased.
* **Top Cluster:** `Claude3.5-Sonnet`, `GPT-4o`, `Qwen2.5-72B-Instruct`, `LLaMA3.1-70B-Instruct`, and `GPT-3.5` are nearly indistinguishable at the top.
* **Dramatic Improvement:** The smaller models (`LLaMA3.1-8B-Instruct`, `Qwen2.5-7B-Instruct`) and the specialized `QWQ-32B-Instruct` show the most dramatic gains, now performing at a level comparable to the much larger models in the baseline.
* **New Entrants:** The dashed lines for `DeepSeek-V3`, `DeepSeek-R1`, and `o3-mini` are also present in this cluster, indicating high performance under the S2 condition.
### Key Observations
1. **Performance Hierarchy:** In the baseline, a clear hierarchy exists: proprietary models (Claude, GPT-4o) > large open-source models (70B/72B) > smaller open-source models (7B/8B).
2. **Benchmark Difficulty:** `MATH` and `AQUA` appear to be the most challenging benchmarks for all models in the baseline, as scores are consistently lowest on these axes.
3. **Specialization:** The `QWQ-32B-Instruct` model exhibits a unique performance profile in the baseline, excelling at `HotpotQA` but struggling with `MATH` and `AQUA`.
4. **Correction Impact:** Both "Intrinsic" (S1) and especially "External" (S2) correction methods lead to substantial performance gains. The S2 condition acts as a powerful equalizer, dramatically reducing the performance gap between model sizes and architectures.
5. **Diminishing Returns:** The improvement from Base to S1 is significant, but the leap from S1 to S2 is even more pronounced, suggesting the external correction method is highly effective.
### Interpretation
This visualization demonstrates the profound impact of correction techniques on LLM benchmark performance. The data suggests that:
* **Raw Capability vs. Corrected Performance:** The baseline ("Base") chart reflects the raw, unaided reasoning and knowledge capabilities of the models, where scale (parameter count) and training data quality create a clear performance stratification.
* **The Power of External Tools/Methods:** The dramatic convergence in the "S2 (External Correction)" chart implies that when models are augmented with external correction mechanisms (which could involve tools, retrieval-augmented generation, or specialized verification modules), their inherent limitations in specific domains (like mathematical reasoning) can be largely overcome. This narrows the gap between smaller and larger models.
* **Benchmark Sensitivity:** The consistent difficulty of `MATH` and `AQUA` in the baseline highlights these as areas where model reasoning is most fragile without assistance. The fact that correction methods most dramatically improve scores on these axes underscores their value for practical applications requiring robust reasoning.
* **Strategic Implication:** For developers, this indicates that investing in external correction systems (S2) may yield greater performance improvements and cost-efficiency (by enabling smaller models to perform like larger ones) than simply scaling up model size alone. The charts argue for a paradigm where model capability is a combination of base model intelligence and the sophistication of its supporting correction ecosystem.
DECODING INTELLIGENCE...