## Directed Graph: State Transition Diagram
### Overview
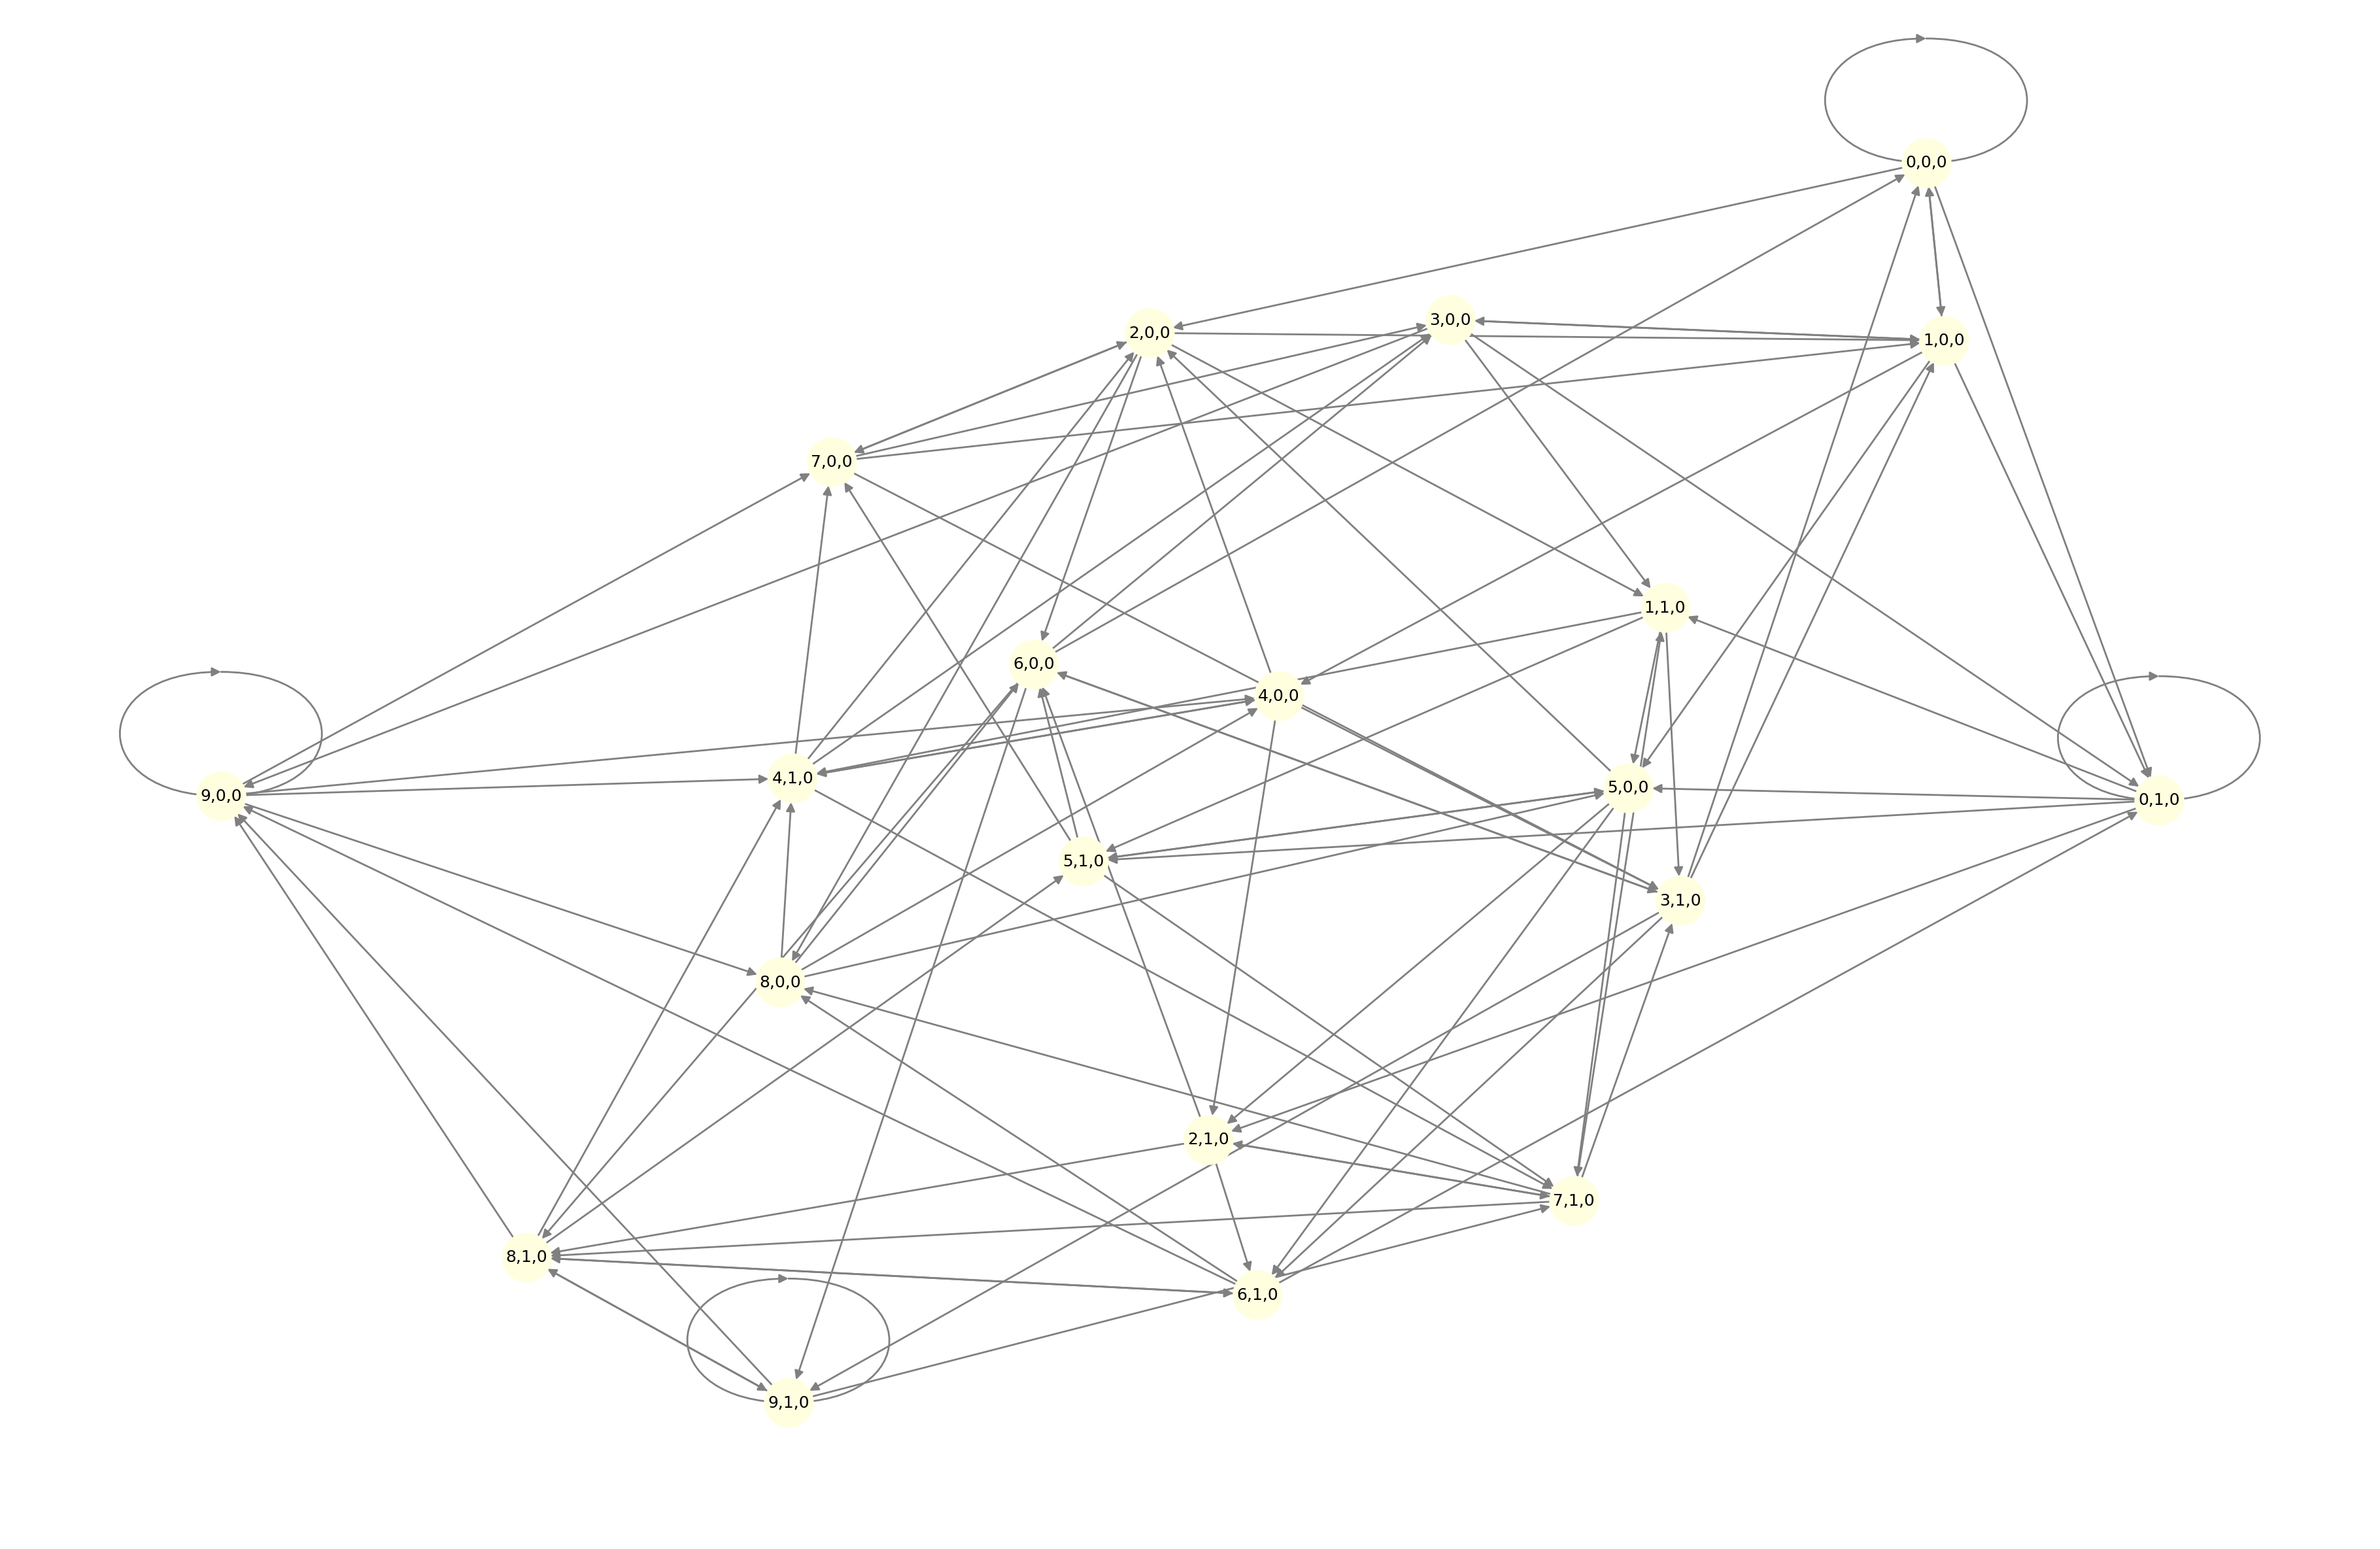
The image depicts a directed graph, also known as a state transition diagram. It consists of nodes (represented as pale yellow circles) labeled with numerical triples and directed edges (gray arrows) indicating transitions between these nodes. Some nodes have self-loops, indicating transitions back to themselves.
### Components/Axes
* **Nodes:** Each node is a pale yellow circle labeled with a numerical triple in the format "X,Y,Z", where X, Y, and Z are integers. The nodes are positioned irregularly across the image.
* **Edges:** The edges are gray arrows indicating the direction of the transition between nodes.
* **Self-Loops:** Some nodes have arrows that loop back to themselves.
### Detailed Analysis or ### Content Details
Here's a breakdown of the nodes and their connections:
* **Node 0,0,0:** Located on the left side of the image. It has a self-loop. It has outgoing edges to nodes 1,0,0; 2,0,0; 4,1,0; 5,1,0; 8,0,0; 9,1,0.
* **Node 0,1,0:** Located on the right side of the image. It has a self-loop. It has outgoing edges to nodes 1,0,0; 3,1,0; 5,0,0; 6,1,0; 7,1,0; 9,1,0.
* **Node 1,0,0:** Located at the top-right of the image. It has a self-loop. It has outgoing edges to nodes 0,0,0; 0,1,0; 1,1,0; 2,0,0; 3,0,0; 4,0,0; 5,0,0; 6,0,0; 7,0,0; 8,0,0; 9,0,0.
* **Node 1,1,0:** Located in the upper-center of the image. It has outgoing edges to nodes 0,0,0; 0,1,0; 3,1,0; 4,1,0; 5,0,0; 5,1,0; 6,0,0; 7,1,0.
* **Node 2,0,0:** Located at the top-center of the image. It has outgoing edges to nodes 0,0,0; 1,0,0; 1,1,0; 3,0,0; 4,0,0; 4,1,0; 6,0,0; 7,0,0; 8,0,0.
* **Node 2,1,0:** Located at the bottom-center of the image. It has outgoing edges to nodes 0,0,0; 0,1,0; 4,1,0; 6,1,0; 7,1,0; 8,0,0; 9,1,0.
* **Node 3,0,0:** Located at the top-center of the image. It has outgoing edges to nodes 0,0,0; 1,0,0; 1,1,0; 4,0,0; 5,0,0; 6,0,0; 7,0,0; 8,0,0.
* **Node 3,1,0:** Located in the center-right of the image. It has outgoing edges to nodes 0,0,0; 0,1,0; 1,1,0; 5,0,0; 5,1,0; 6,1,0; 7,1,0; 9,1,0.
* **Node 4,0,0:** Located in the center of the image. It has outgoing edges to nodes 0,0,0; 1,0,0; 1,1,0; 4,1,0; 5,0,0; 6,0,0; 7,0,0; 8,0,0.
* **Node 4,1,0:** Located on the left side of the image. It has outgoing edges to nodes 0,0,0; 1,1,0; 2,1,0; 5,1,0; 6,0,0; 8,0,0; 9,1,0.
* **Node 5,0,0:** Located in the center-right of the image. It has outgoing edges to nodes 0,0,0; 0,1,0; 1,0,0; 1,1,0; 3,1,0; 4,0,0; 6,0,0; 7,1,0.
* **Node 5,1,0:** Located in the center of the image. It has outgoing edges to nodes 0,0,0; 1,1,0; 3,1,0; 4,1,0; 6,0,0; 6,1,0; 8,0,0; 9,1,0.
* **Node 6,0,0:** Located in the center of the image. It has outgoing edges to nodes 0,0,0; 1,0,0; 1,1,0; 4,0,0; 4,1,0; 5,0,0; 5,1,0; 7,0,0; 8,0,0.
* **Node 6,1,0:** Located at the bottom-center of the image. It has outgoing edges to nodes 0,0,0; 0,1,0; 2,1,0; 3,1,0; 5,1,0; 7,1,0; 9,1,0.
* **Node 7,0,0:** Located on the left side of the image. It has outgoing edges to nodes 0,0,0; 1,0,0; 2,0,0; 3,0,0; 4,0,0; 6,0,0; 8,0,0.
* **Node 7,1,0:** Located at the bottom-right of the image. It has outgoing edges to nodes 0,0,0; 0,1,0; 1,1,0; 2,1,0; 3,1,0; 5,0,0; 6,1,0; 9,1,0.
* **Node 8,0,0:** Located on the left side of the image. It has outgoing edges to nodes 0,0,0; 1,0,0; 2,0,0; 2,1,0; 3,0,0; 4,0,0; 4,1,0; 5,1,0; 6,0,0; 7,0,0.
* **Node 8,1,0:** Located at the bottom-left of the image. It has a self-loop. It has outgoing edges to nodes 0,0,0; 2,1,0; 4,1,0; 6,1,0; 9,1,0.
* **Node 9,0,0:** Located at the top of the image. It has outgoing edges to nodes 0,0,0; 1,0,0; 2,0,0; 3,0,0; 4,0,0; 6,0,0; 7,0,0; 8,0,0.
* **Node 9,1,0:** Located at the bottom of the image. It has a self-loop. It has outgoing edges to nodes 0,0,0; 0,1,0; 2,1,0; 3,1,0; 4,1,0; 5,1,0; 6,1,0; 7,1,0; 8,1,0.
### Key Observations
* Nodes 0,0,0; 0,1,0; 8,1,0; and 9,1,0 have self-loops.
* Node 1,0,0 has outgoing edges to all other nodes.
* Nodes 0,0,0 and 0,1,0 are the most common destination nodes.
* The graph appears highly interconnected, with many nodes having multiple incoming and outgoing edges.
### Interpretation
The diagram represents a state transition system where each node represents a state, and the arrows represent possible transitions between states. The numerical triples labeling the nodes likely represent some internal state variables or parameters. The self-loops indicate that the system can remain in the same state. The high degree of interconnectedness suggests that the system can transition between many different states. The diagram could represent a variety of systems, such as a Markov chain, a finite state machine, or a model of a physical process. Without further context, it is difficult to determine the specific meaning of the states and transitions.