\n
## Diagram: Network Graph
### Overview
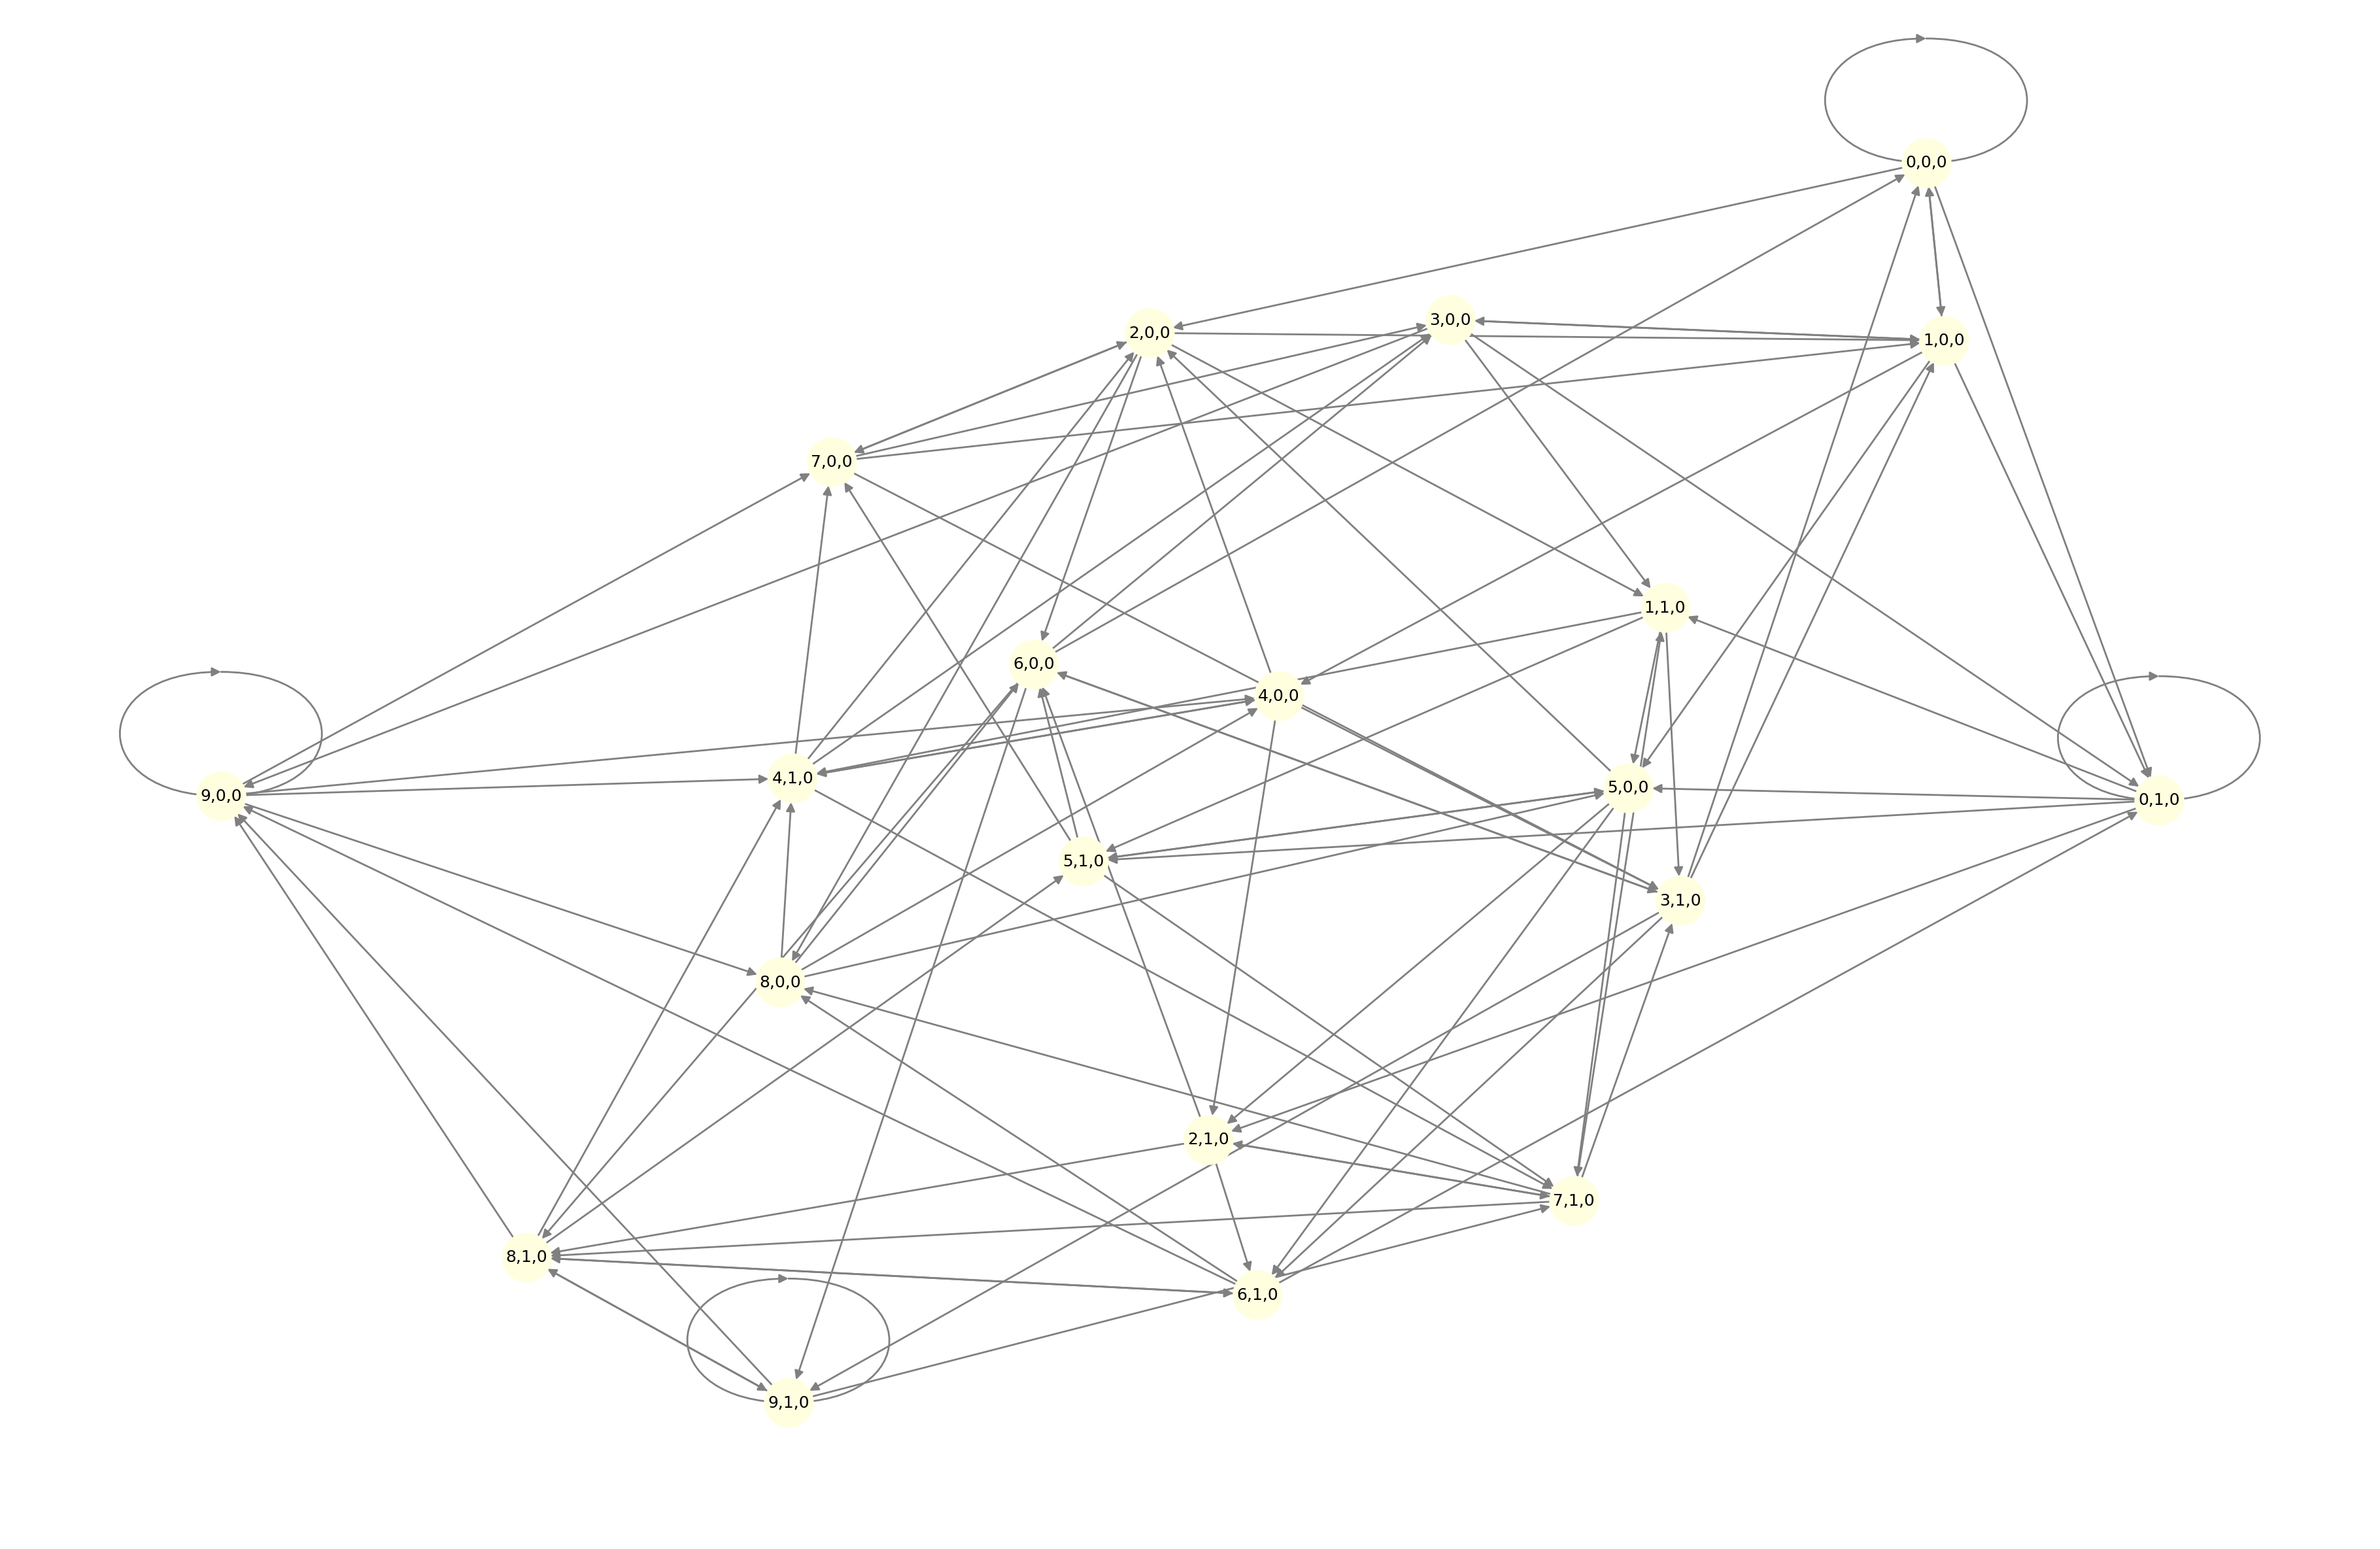
The image depicts a directed network graph with 12 nodes, each labeled with a numerical value. The nodes are interconnected by directed edges (arrows), indicating the flow or relationship between them. The graph appears to be laid out without a clear geometric structure, with connections spanning across the entire image.
### Components/Axes
There are no explicit axes or legends in the image. The components are solely the nodes and the directed edges connecting them. Each node is represented by a circle containing a numerical label.
### Detailed Analysis or Content Details
The nodes and their connections are as follows:
* **0.0:** Located at the top-center. Has incoming edges from 1.0, 2.0, and 3.0.
* **1.0:** Located towards the top-right. Has incoming edges from 4.0 and 5.0, and an outgoing edge to 0.0.
* **2.0:** Located towards the top-center-left. Has incoming edges from 6.0 and 7.0, and an outgoing edge to 0.0.
* **3.0:** Located towards the top-right-center. Has incoming edges from 6.0 and 7.0, and an outgoing edge to 0.0.
* **4.0:** Located towards the center-right. Has incoming edges from 5.0 and 8.0, and an outgoing edge to 1.0.
* **5.0:** Located towards the center-right-bottom. Has incoming edges from 8.0 and 9.0, and outgoing edges to 1.0 and 4.0.
* **6.0:** Located towards the center-left. Has incoming edges from 8.0 and 9.0, and outgoing edges to 2.0 and 3.0.
* **7.0:** Located towards the top-left. Has incoming edges from 9.0 and 8.0, and outgoing edges to 2.0 and 3.0.
* **8.0:** Located towards the bottom-left. Has outgoing edges to 4.0, 5.0, 6.0, and 7.0.
* **9.0:** Located towards the bottom-left. Has outgoing edges to 5.0, 6.0, and 7.0.
* **10.0:** Located towards the top-right. Has an outgoing edge to 0.0.
* **11.0:** Located towards the center-right. Has an outgoing edge to 0.0.
The edges are directed, meaning the relationship is not necessarily reciprocal. For example, 4.0 points to 1.0, but there is no edge from 1.0 to 4.0.
### Key Observations
* Nodes 0.0, 1.0, 2.0, 3.0, 4.0, 5.0, 6.0, 7.0, 8.0, 9.0, 10.0, and 11.0 all have varying degrees of connectivity.
* Nodes 8.0 and 9.0 have the highest out-degree, each connecting to four other nodes.
* Node 0.0 has the highest in-degree, receiving connections from three other nodes.
* The graph appears to be somewhat hierarchical, with nodes 8.0 and 9.0 acting as primary sources and 0.0 as a central sink.
### Interpretation
The diagram represents a directed network, potentially illustrating a flow of information, dependencies, or influence between different entities. The numerical labels on the nodes could represent various attributes, such as importance, capacity, or cost. The connections indicate a relationship where the source node influences or contributes to the target node.
The high connectivity of nodes 8.0 and 9.0 suggests they are key drivers or sources within the network. The convergence of connections at node 0.0 indicates it may represent a final destination, aggregation point, or critical component.
Without further context, it's difficult to determine the specific meaning of the network. However, the structure suggests a system where multiple inputs (from 8.0 and 9.0) are processed and ultimately converge at a single output (0.0). The intermediate nodes (1.0 through 7.0) likely represent stages or components in this process. The lack of reciprocal connections suggests a unidirectional flow of influence or information. The diagram could represent a workflow, a decision tree, or a dependency graph.