## Network Diagram: Directed Graph with Labeled Nodes
### Overview
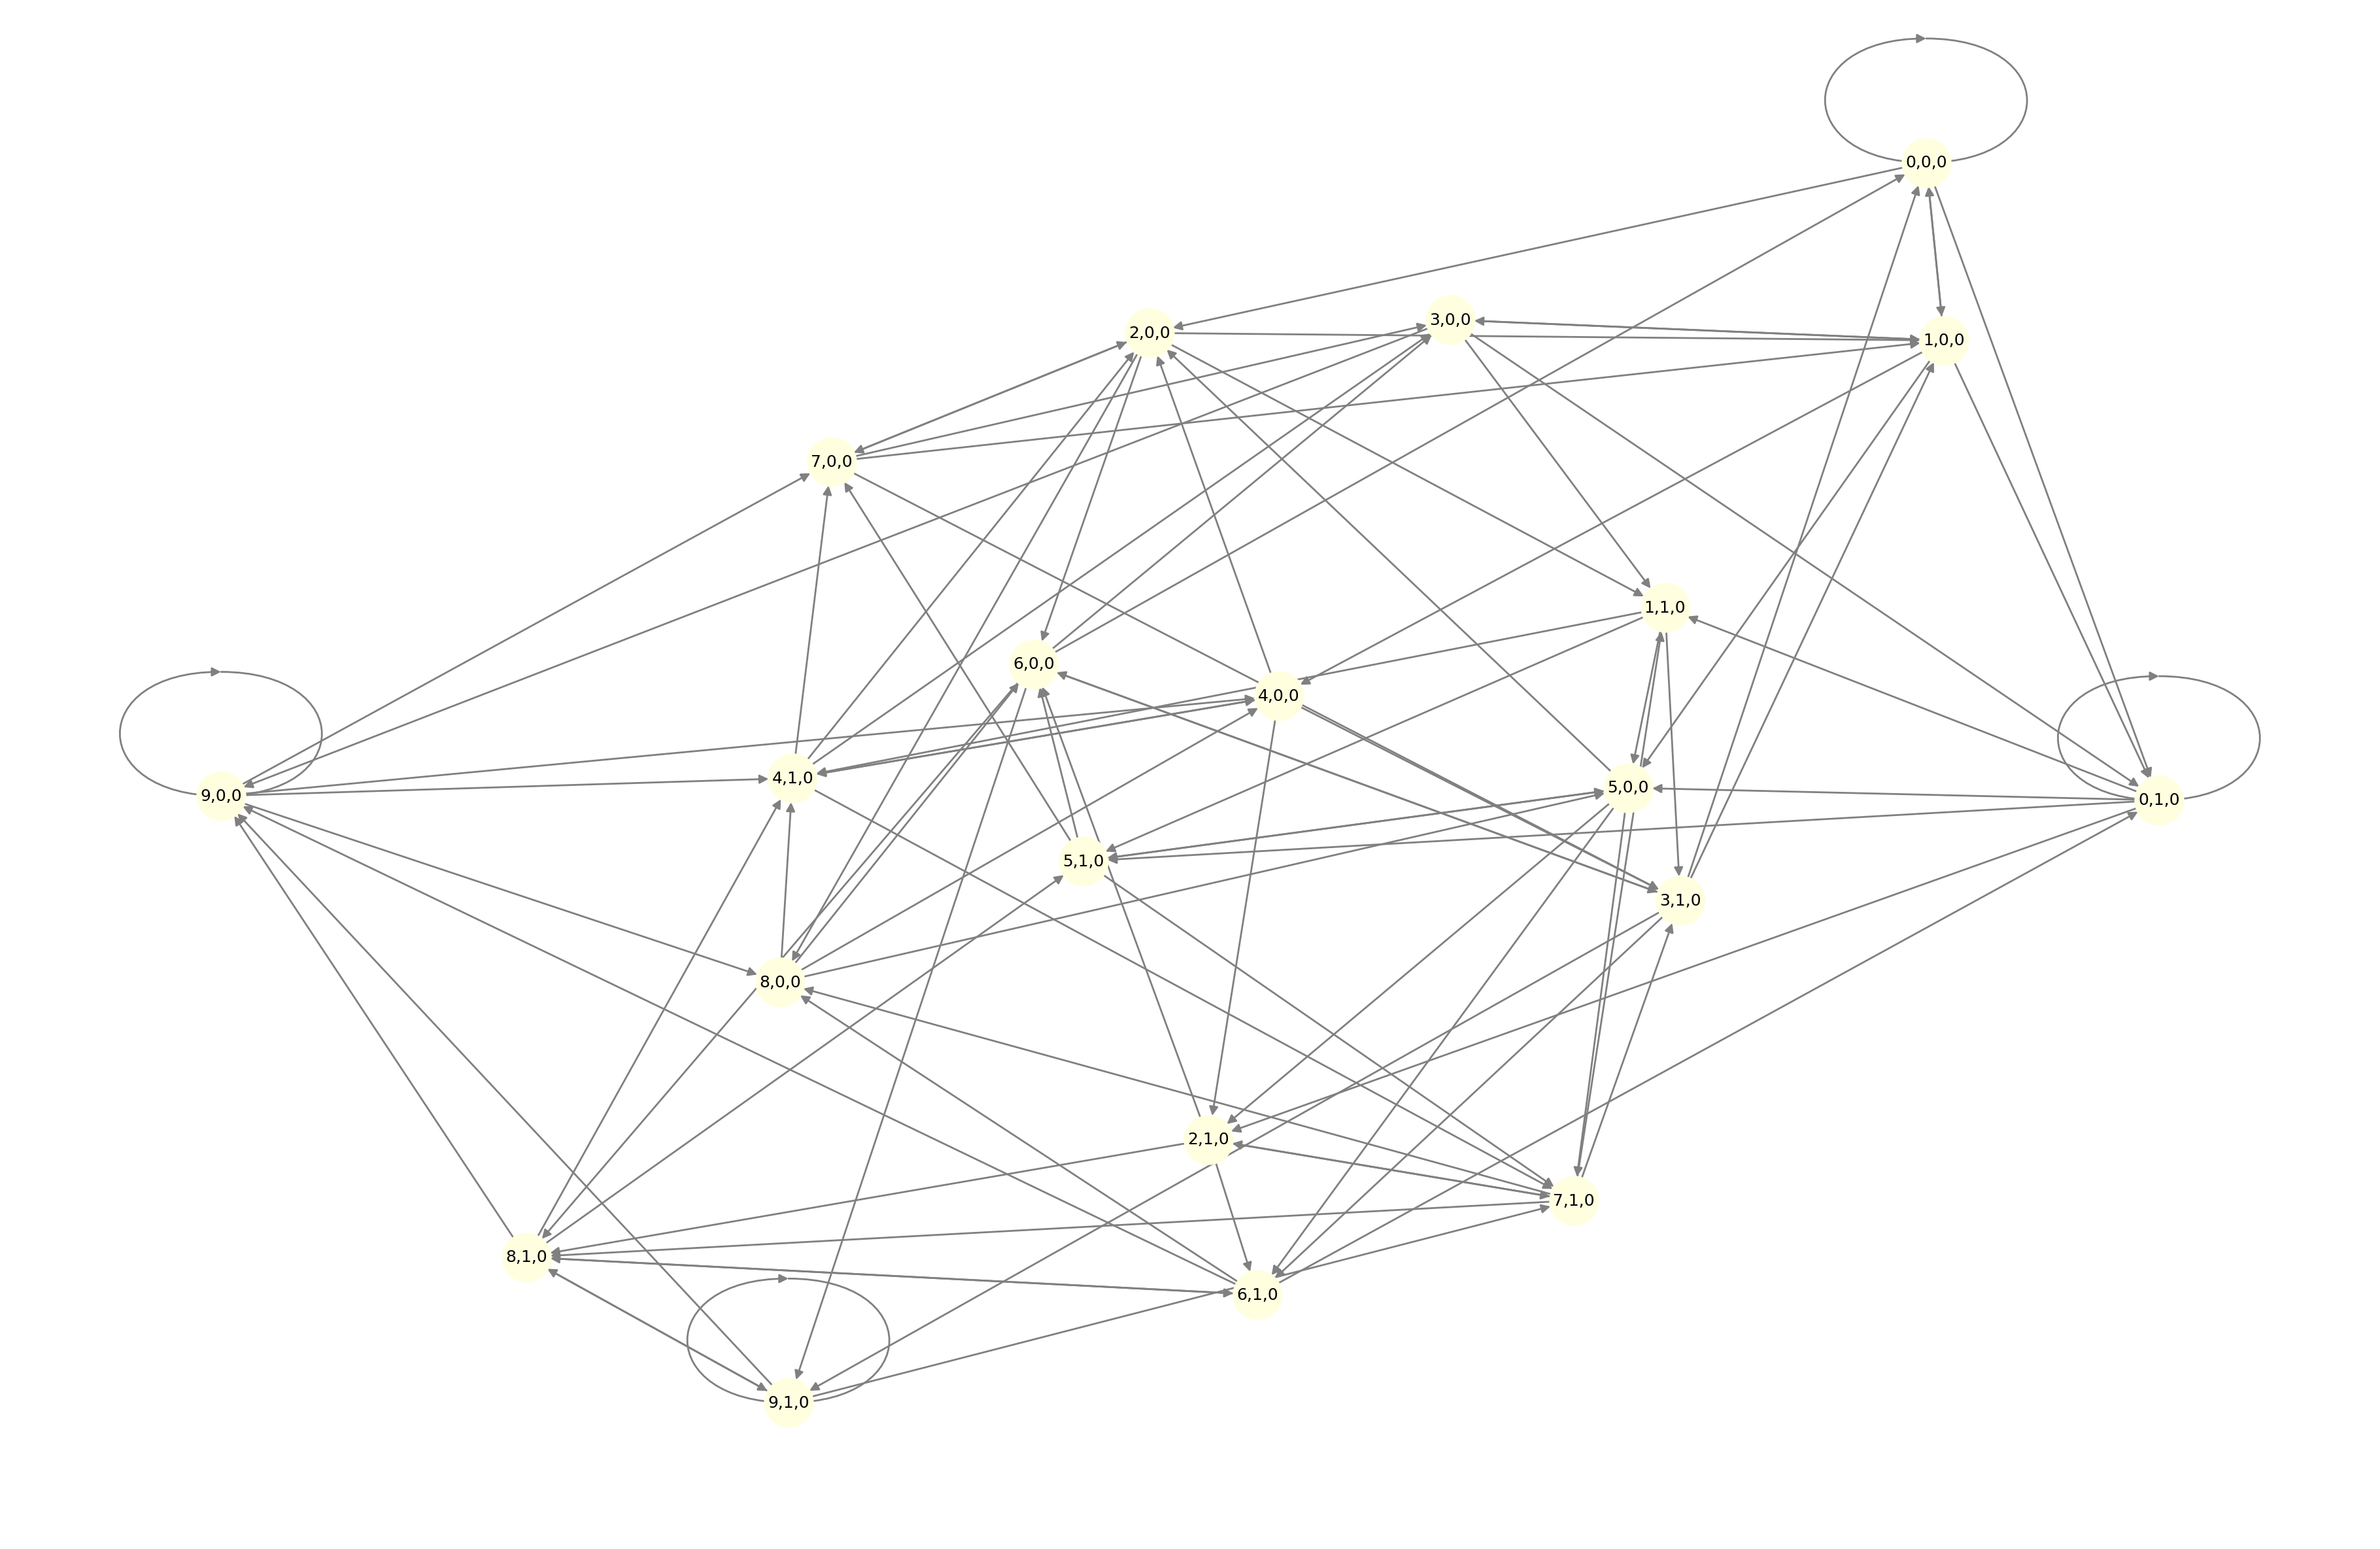
The image depicts a complex directed graph with 12 labeled nodes (e.g., 0.0, 1.0, 2.0, ..., 9.0, 8.1, 9.1) connected by bidirectional arrows. The nodes are arranged in a non-linear, interconnected pattern, forming multiple cycles and overlapping pathways. No legends, axis titles, or additional textual elements are present.
### Components/Axes
- **Nodes**: Labeled with numerical identifiers (e.g., 0.0, 1.0, 2.0, ..., 9.0, 8.1, 9.1).
- **Edges**: Directed arrows connecting nodes, indicating one-way relationships.
- **Structure**: Dense, overlapping connections with no clear hierarchical or sequential order.
### Detailed Analysis
- **Node Labels**:
- Primary nodes: 0.0, 1.0, 2.0, 3.0, 4.0, 5.0, 6.0, 7.0, 8.0, 9.0.
- Sub-nodes: 8.1, 9.1 (possibly indicating sub-states or variations).
- **Connections**:
- Node 0.0 connects to 1.0, 2.0, 3.0, 4.0, 5.0, 6.0, 7.0, 8.0, 9.0.
- Node 9.0 connects to 0.0, 1.0, 2.0, 3.0, 4.0, 5.0, 6.0, 7.0, 8.0.
- Sub-nodes (8.1, 9.1) connect to adjacent nodes (e.g., 8.1 → 9.0, 9.1 → 0.0).
- **Cycles**: Multiple feedback loops (e.g., 0.0 → 1.0 → 2.0 → 3.0 → 4.0 → 5.0 → 6.0 → 7.0 → 8.0 → 9.0 → 0.0).
### Key Observations
- **High Connectivity**: Each node has multiple outgoing and incoming edges, suggesting a highly interdependent system.
- **Sub-Node Labels**: 8.1 and 9.1 may represent specialized or transitional states within the primary nodes.
- **Cyclic Nature**: The presence of cycles implies potential for infinite loops or recurring processes.
### Interpretation
This diagram likely represents a **state transition system** or **network topology** with:
- **Feedback Mechanisms**: Cycles suggest the system can revisit previous states, indicating potential for loops or recurring behaviors.
- **Sub-State Differentiation**: Decimal labels (8.1, 9.1) might denote specific sub-states or variations within broader categories (e.g., 8.0, 9.0).
- **Complex Interactions**: The dense connections imply a system with many possible pathways, requiring careful analysis to trace dependencies or transitions.
No numerical data or trends are explicitly provided, but the structure emphasizes **interconnectedness** and **cyclic behavior**. The absence of legends or axis labels limits quantitative interpretation, but the diagram’s complexity suggests a focus on relational dynamics rather than scalar metrics.