## Chart: Experienced Items Ratio vs. Environment Step
### Overview
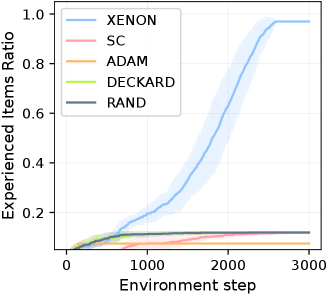
The image is a line chart comparing the "Experienced Items Ratio" of five different algorithms (XENON, SC, ADAM, DECKARD, and RAND) over a range of "Environment steps". The chart shows how the ratio changes as the environment step increases.
### Components/Axes
* **X-axis:** "Environment step", ranging from 0 to 3000.
* **Y-axis:** "Experienced Items Ratio", ranging from 0.0 to 1.0.
* **Legend:** Located in the top-left corner, associating each algorithm with a specific color.
* XENON: Light blue
* SC: Light red
* ADAM: Light orange
* DECKARD: Light green
* RAND: Dark gray
* **Gridlines:** Light gray, providing visual reference points.
### Detailed Analysis
* **XENON (Light Blue):** The line starts near 0.0 and gradually increases until approximately environment step 1000. It then exhibits a steeper increase, reaching nearly 1.0 around environment step 2500. There is a shaded region around the line, indicating variance or confidence intervals.
* At step 0, ratio ~ 0.0
* At step 1000, ratio ~ 0.15
* At step 2000, ratio ~ 0.6
* At step 2500, ratio ~ 0.95
* At step 3000, ratio ~ 0.98
* **SC (Light Red):** The line remains relatively flat and close to 0.0 throughout the entire range of environment steps.
* At step 0, ratio ~ 0.0
* At step 3000, ratio ~ 0.02
* **ADAM (Light Orange):** The line also remains relatively flat and close to 0.0 throughout the entire range of environment steps, slightly higher than SC.
* At step 0, ratio ~ 0.0
* At step 3000, ratio ~ 0.04
* **DECKARD (Light Green):** The line increases slightly in the beginning, then plateaus around 0.1.
* At step 0, ratio ~ 0.0
* At step 500, ratio ~ 0.1
* At step 3000, ratio ~ 0.1
* **RAND (Dark Gray):** The line increases slightly in the beginning, then plateaus around 0.12.
* At step 0, ratio ~ 0.0
* At step 500, ratio ~ 0.1
* At step 3000, ratio ~ 0.12
### Key Observations
* XENON significantly outperforms the other algorithms in terms of "Experienced Items Ratio".
* SC and ADAM have very low "Experienced Items Ratio" throughout the experiment.
* DECKARD and RAND perform similarly, with a slightly higher ratio than SC and ADAM, but significantly lower than XENON.
* The shaded region around the XENON line indicates variability in its performance.
### Interpretation
The chart demonstrates the effectiveness of the XENON algorithm in experiencing items within the environment compared to the other algorithms tested. The XENON algorithm shows a clear upward trend, indicating that it learns and explores the environment more efficiently as the number of environment steps increases. In contrast, SC, ADAM, DECKARD, and RAND show minimal improvement in the "Experienced Items Ratio," suggesting they are less effective at exploring or learning from the environment. The shaded region around the XENON line suggests that its performance may vary across different runs or conditions, but it consistently outperforms the other algorithms.