## Line Chart: Experienced Items Ratio vs. Environment Step
### Overview
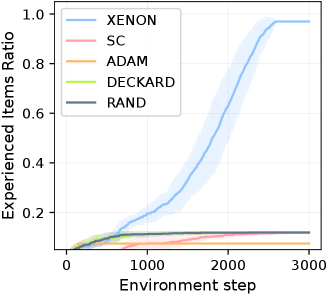
This image presents a line chart illustrating the ratio of experienced items over environment steps for five different algorithms: XENON, SC, ADAM, DECKARD, and RAND. The chart displays the learning progress of each algorithm as it interacts with an environment, measured by the proportion of items encountered. The y-axis represents the "Experienced Items Ratio" and the x-axis represents the "Environment Step". Each line represents the average performance of an algorithm, with a shaded area indicating the variance or confidence interval around that average.
### Components/Axes
* **X-axis:** "Environment step" ranging from approximately 0 to 3000. The axis is linearly scaled.
* **Y-axis:** "Experienced Items Ratio" ranging from approximately 0 to 1.0. The axis is linearly scaled.
* **Legend:** Located in the top-left corner of the chart. It identifies the five algorithms using both names and corresponding line colors:
* XENON (Light Blue)
* SC (Light Red/Pink)
* ADAM (Orange)
* DECKARD (Light Green)
* RAND (Dark Blue)
### Detailed Analysis
* **XENON:** The XENON line (light blue) starts at approximately 0.02 at Environment Step 0. It exhibits a steep upward trend, increasing rapidly between Environment Steps 1000 and 2000. It reaches approximately 0.95 at Environment Step 2000 and plateaus around 0.98 by Environment Step 3000. The shaded area around the line indicates a relatively large variance initially, which decreases as the algorithm progresses.
* **SC:** The SC line (light red/pink) begins at approximately 0.03 at Environment Step 0. It shows a slow, gradual increase, reaching approximately 0.15 at Environment Step 3000. The line remains relatively flat throughout the entire range of Environment Steps. The shaded area is relatively small, indicating low variance.
* **ADAM:** The ADAM line (orange) starts at approximately 0.02 at Environment Step 0. It shows a very slow, almost flat increase, reaching approximately 0.08 at Environment Step 3000. The shaded area is small, indicating low variance.
* **DECKARD:** The DECKARD line (light green) begins at approximately 0.03 at Environment Step 0. It shows a slight increase up to approximately 0.1 at Environment Step 1000, then plateaus and remains relatively constant at around 0.12 for the rest of the Environment Steps. The shaded area is small, indicating low variance.
* **RAND:** The RAND line (dark blue) starts at approximately 0.02 at Environment Step 0. It shows a steady, but slower than XENON, increase. It reaches approximately 0.8 at Environment Step 1500, and then continues to increase, reaching approximately 0.95 at Environment Step 3000. The shaded area is relatively large initially, decreasing as the algorithm progresses.
### Key Observations
* XENON demonstrates the fastest learning rate, achieving a high Experienced Items Ratio significantly faster than other algorithms.
* SC, ADAM, and DECKARD exhibit very slow learning rates, remaining at low Experienced Items Ratios throughout the observed Environment Steps.
* RAND shows a moderate learning rate, slower than XENON but faster than SC, ADAM, and DECKARD.
* The variance (represented by the shaded areas) is highest for XENON and RAND initially, suggesting more variability in their performance during the early stages of learning.
### Interpretation
The chart suggests that the XENON algorithm is the most effective at exploring and experiencing items in the environment, followed by RAND. SC, ADAM, and DECKARD algorithms are significantly less efficient in this regard. The rapid increase in the Experienced Items Ratio for XENON indicates a quick adaptation and learning process. The relatively flat lines for SC, ADAM, and DECKARD suggest that these algorithms may be stuck in suboptimal exploration strategies or have limited capacity to learn from the environment. The shaded areas around each line represent the uncertainty or variability in the algorithm's performance. The decreasing variance for XENON and RAND as the Environment Step increases suggests that these algorithms become more consistent in their performance as they gain more experience. This data could be used to compare the effectiveness of different reinforcement learning algorithms or exploration strategies in a given environment. The differences in learning rates could be attributed to factors such as the algorithm's exploration policy, learning rate, or the complexity of the environment.