## Heatmap: Quantile Value Analysis Across Quantization Levels
### Overview
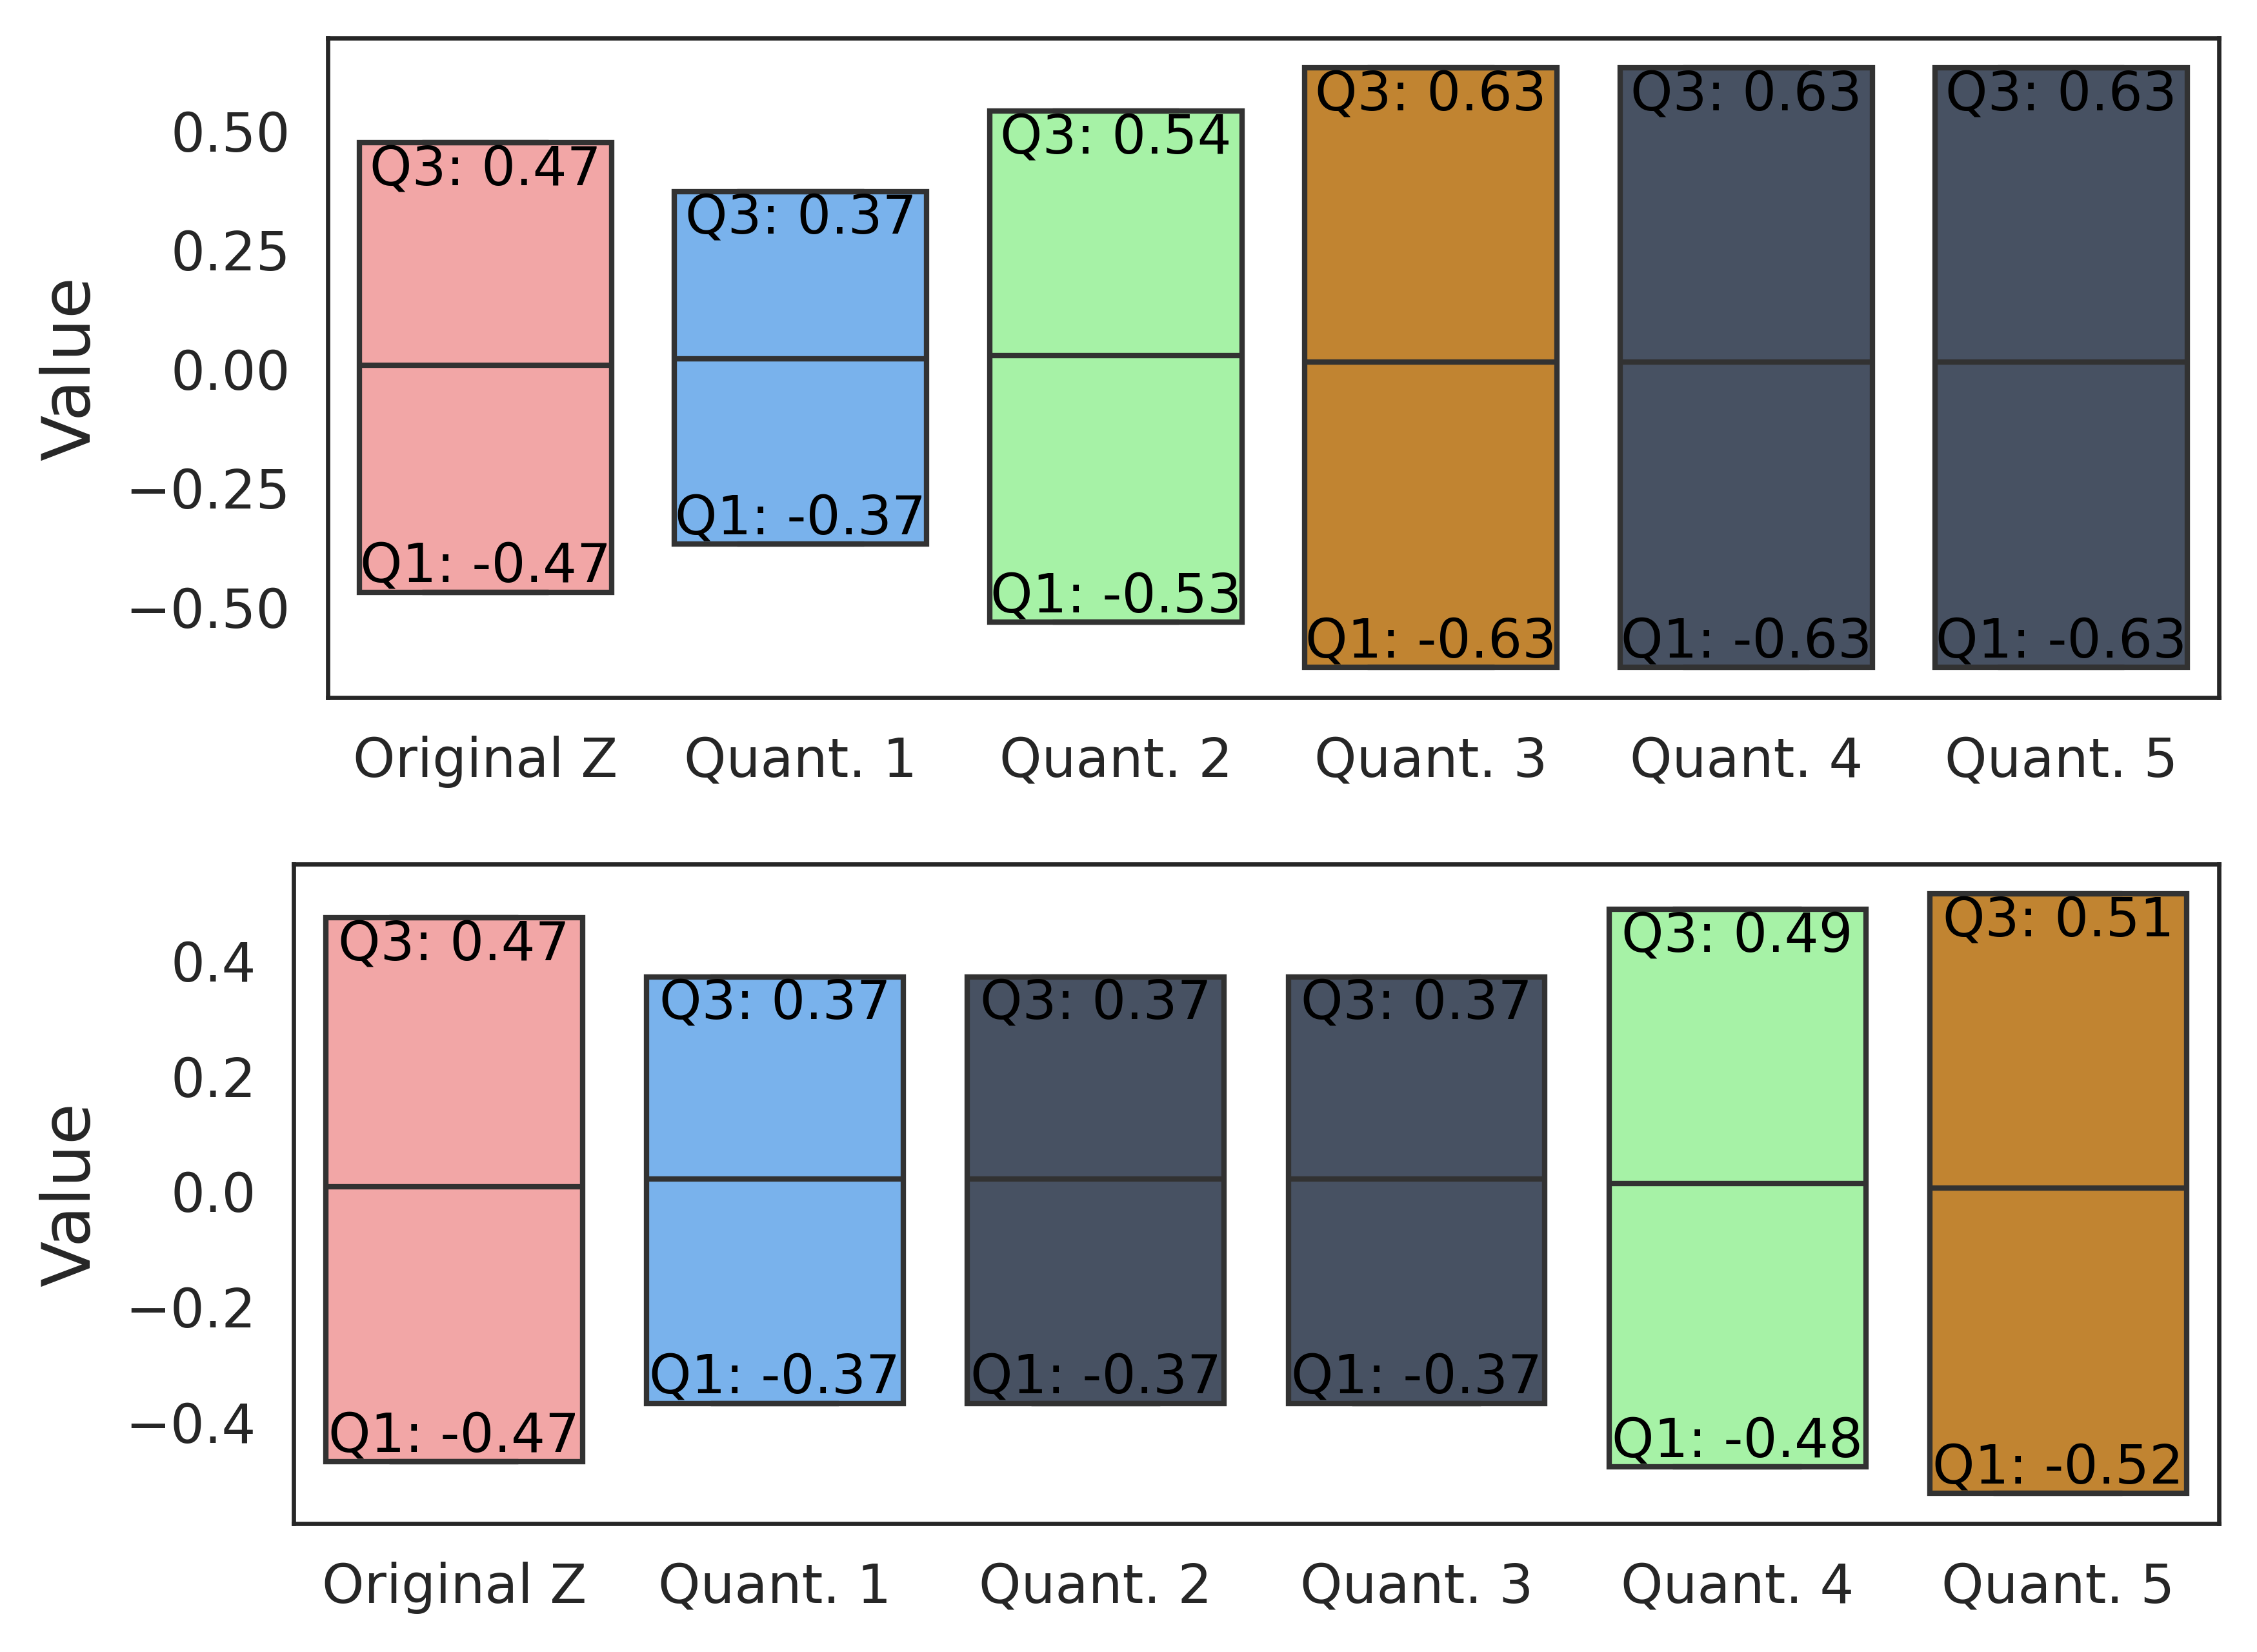
The image contains two vertically stacked heatmaps comparing quantile values (Q1 and Q3) across six quantization levels ("Original Z" to "Quant. 5"). Values are color-coded (red for negative, green/orange for positive) and labeled with precise numerical values. Both heatmaps share identical column labels but differ in value distributions.
---
### Components/Axes
- **X-axis (Columns)**:
- Labels: "Original Z", "Quant. 1", "Quant. 2", "Quant. 3", "Quant. 4", "Quant. 5"
- Position: Bottom of both heatmaps
- **Y-axis (Rows)**:
- Labels: "Q1" (lower row), "Q3" (upper row)
- Position: Left side of both heatmaps
- **Color Coding**:
- Red: Negative values (Q1)
- Green/Orange: Positive values (Q3)
- No explicit legend; colors inferred from value polarity
---
### Detailed Analysis
#### First Heatmap (Top)
| Column | Q3 Value | Q1 Value | Color |
|--------------|----------|----------|-------------|
| Original Z | 0.47 | -0.47 | Red/Green |
| Quant. 1 | 0.37 | -0.37 | Blue |
| Quant. 2 | 0.54 | -0.53 | Green |
| Quant. 3 | 0.63 | -0.63 | Orange |
| Quant. 4 | 0.63 | -0.63 | Dark Blue |
| Quant. 5 | 0.63 | -0.63 | Dark Blue |
#### Second Heatmap (Bottom)
| Column | Q3 Value | Q1 Value | Color |
|--------------|----------|----------|-------------|
| Original Z | 0.47 | -0.47 | Red/Green |
| Quant. 1 | 0.37 | -0.37 | Blue |
| Quant. 2 | 0.37 | -0.37 | Dark Blue |
| Quant. 3 | 0.37 | -0.37 | Dark Blue |
| Quant. 4 | 0.49 | -0.48 | Green |
| Quant. 5 | 0.51 | -0.52 | Orange |
---
### Key Observations
1. **Trend Verification**:
- **First Heatmap**:
- Q3 values increase monotonically from 0.47 (Original Z) to 0.63 (Quant. 3-5).
- Q1 values decrease monotonically from -0.47 (Original Z) to -0.63 (Quant. 3-5).
- **Second Heatmap**:
- Q3 values plateau at 0.37 (Quant. 1-3) before rising to 0.49 (Quant. 4) and 0.51 (Quant. 5).
- Q1 values remain constant at -0.37 (Quant. 1-3) before dropping to -0.48 (Quant. 4) and -0.52 (Quant. 5).
2. **Color Consistency**:
- Negative values (Q1) are consistently red/dark blue.
- Positive values (Q3) transition from red (small positives) to green/orange (larger positives).
3. **Spatial Grounding**:
- Both heatmaps share identical column labels but differ in value distributions.
- Q3 values dominate the upper half (green/orange), while Q1 values occupy the lower half (red/dark blue).
---
### Interpretation
1. **Data Trends**:
- The first heatmap suggests that quantization generally amplifies Q3 values while reducing Q1 values, with stabilization at Quant. 3-5.
- The second heatmap shows a more nuanced pattern: Q3 values stabilize early (Quant. 1-3) before increasing, while Q1 values remain flat until later quantization levels.
2. **Outliers/Anomalies**:
- In the first heatmap, Quant. 2 shows a slight divergence (Q3: 0.54, Q1: -0.53) compared to subsequent levels.
- The second heatmap’s Quant. 5 exhibits the largest Q1 drop (-0.52), indicating potential sensitivity to extreme quantization.
3. **Technical Implications**:
- Quantization appears to compress value distributions differently for Q1 and Q3, with Q3 benefiting more from higher quantization levels.
- The divergence between heatmaps suggests methodological differences in quantization or data preprocessing.
---
### Conclusion
The heatmaps reveal systematic shifts in quantile values across quantization levels, with Q3 consistently outperforming Q1 in magnitude. The second heatmap’s plateau and late-stage divergence highlight potential trade-offs in quantization strategies, warranting further investigation into optimization criteria.