\n
## Line Charts: Naming and Decomposition Accuracy vs. Model Size
### Overview
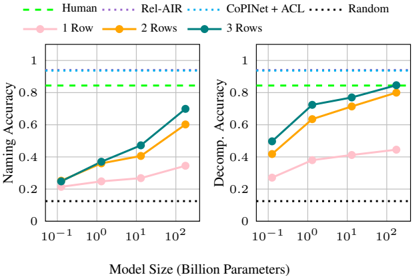
The image contains two side-by-side line charts comparing the performance of different methods on two tasks ("Naming Accuracy" and "Decomp. Accuracy") as a function of model size. The charts include baseline comparisons (Human, Rel-AIR, CoPiNet+ACL, Random) and three experimental conditions (1 Row, 2 Rows, 3 Rows).
### Components/Axes
* **Legend (Top Center):** A shared legend spans the top of both charts.
* **Baselines (Dashed/Dotted Lines):**
* `Human` (Green, dashed line)
* `Rel-AIR` (Blue, dotted line)
* `CoPiNet+ACL` (Cyan, dotted line)
* `Random` (Black, dotted line)
* **Experimental Conditions (Solid Lines with Markers):**
* `1 Row` (Pink line, circle markers)
* `2 Rows` (Orange line, circle markers)
* `3 Rows` (Teal line, circle markers)
* **X-Axis (Both Charts):** `Model Size (Billion Parameters)`. It uses a logarithmic scale with major ticks at `10^-1` (0.1B), `10^0` (1B), `10^1` (10B), and `10^2` (100B).
* **Y-Axis (Left Chart):** `Naming Accuracy`. Linear scale from 0 to 1, with ticks at 0, 0.2, 0.4, 0.6, 0.8, 1.
* **Y-Axis (Right Chart):** `Decomp. Accuracy` (presumably "Decomposition Accuracy"). Linear scale from 0 to 1, with ticks at 0, 0.2, 0.4, 0.6, 0.8, 1.
### Detailed Analysis
**Left Chart: Naming Accuracy**
* **Baselines (Horizontal Lines):**
* `Rel-AIR`: Constant at ~1.0 (top of chart).
* `CoPiNet+ACL`: Constant at ~0.95.
* `Human`: Constant at ~0.85.
* `Random`: Constant at ~0.1.
* **Experimental Conditions (Trends & Approximate Points):**
* **Trend:** All three lines show a clear upward trend, with accuracy increasing as model size grows. The slope is steepest between 0.1B and 10B parameters.
* `3 Rows` (Teal): Starts at ~0.25 (0.1B), rises to ~0.4 (1B), ~0.5 (10B), and ends at ~0.7 (100B).
* `2 Rows` (Orange): Starts at ~0.22 (0.1B), rises to ~0.35 (1B), ~0.45 (10B), and ends at ~0.6 (100B).
* `1 Row` (Pink): Starts at ~0.2 (0.1B), rises to ~0.25 (1B), ~0.28 (10B), and ends at ~0.35 (100B).
**Right Chart: Decomp. Accuracy**
* **Baselines (Horizontal Lines):**
* `CoPiNet+ACL`: Constant at ~0.95.
* `Human`: Constant at ~0.85.
* `Rel-AIR`: Not plotted on this chart.
* `Random`: Constant at ~0.1.
* **Experimental Conditions (Trends & Approximate Points):**
* **Trend:** All three lines show a strong upward trend, with a particularly sharp increase between 0.1B and 1B parameters. Performance appears to plateau slightly after 10B.
* `3 Rows` (Teal): Starts at ~0.5 (0.1B), rises sharply to ~0.72 (1B), then to ~0.8 (10B), and ends at ~0.85 (100B).
* `2 Rows` (Orange): Starts at ~0.42 (0.1B), rises to ~0.62 (1B), then to ~0.72 (10B), and ends at ~0.8 (100B).
* `1 Row` (Pink): Starts at ~0.28 (0.1B), rises to ~0.38 (1B), then to ~0.42 (10B), and ends at ~0.45 (100B).
### Key Observations
1. **Scaling Law:** Performance on both tasks improves with model size for the `1/2/3 Rows` methods, demonstrating a clear scaling effect.
2. **Row Advantage:** The `3 Rows` condition consistently outperforms `2 Rows`, which outperforms `1 Row`.
3. **Decomp. Accuracy is generally higher than Naming Accuracy for the same model size and row condition, especially at smaller scales.**
4. **Gap to Baselines:** Even the best-performing experimental condition (`3 Rows` at 100B) does not reach the performance of the `Human` or `CoPiNet+ACL` baselines on either task. The `Random` baseline is far below all other methods.
5. **Convergence:** On the Decomp. Accuracy task, the `3 Rows` line appears to converge toward the `Human` baseline at the largest model size (100B).
### Interpretation
This data suggests a research study evaluating a model's ability to perform compositional tasks (naming and decomposition) as it scales. The "Rows" likely refer to the complexity or amount of structured input provided to the model.
* **What the data demonstrates:** The models benefit significantly from both increased scale (parameters) and increased structured input (more rows). The task of decomposition appears to be "easier" for the models to learn or scale on than naming, as evidenced by higher absolute accuracies and a steeper initial learning curve.
* **Relationship between elements:** The charts are designed to show that while scaling helps, the proposed methods (`1/2/3 Rows`) are still sub-human and below a strong prior method (`CoPiNet+ACL`). The `Rel-AIR` baseline, which is perfect on Naming, is notably absent from the Decomp. chart, possibly indicating it is not applicable or was not evaluated on that task.
* **Notable patterns:** The most significant finding is the consistent, ordered benefit of adding more rows of context. This implies that the model's capacity to utilize structured information is a key factor in its performance on these compositional tasks. The plateau in Decomp. Accuracy for `3 Rows` after 10B parameters might indicate a data or method limitation rather than a model capacity limit.