## Line Graphs: Naming Accuracy vs. Decomposition Accuracy Across Model Sizes
### Overview
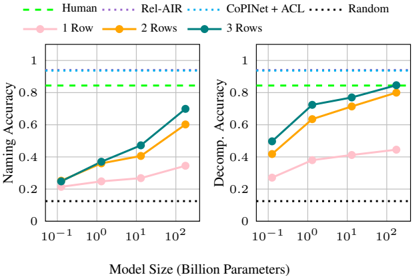
The image contains two line graphs comparing accuracy metrics (Naming Accuracy and Decomposition Accuracy) across different model sizes (10⁻¹ to 10² billion parameters). The graphs include human performance baselines, random chance baselines, and three model configurations (1 Row, 2 Rows, 3 Rows). Key trends show performance improvements with increasing model size and row configurations.
---
### Components/Axes
- **X-axis**: Model Size (Billion Parameters)
- Logarithmic scale: 10⁻¹, 10⁰, 10¹, 10²
- **Y-axis (Left Graph)**: Naming Accuracy (0–1)
- **Y-axis (Right Graph)**: Decomposition Accuracy (0–1)
- **Legends**:
- **Human**: Green dashed line (Naming: ~0.85, Decomp: ~0.85)
- **Rel-AIR**: Purple dotted line (Naming: ~0.9, Decomp: ~0.9)
- **CoPINet + ACL**: Blue dotted line (Naming: ~0.95, Decomp: ~0.95)
- **Random**: Black dotted line (Naming: ~0.5, Decomp: ~0.5)
- **1 Row**: Pink line (Naming: 0.2→0.35, Decomp: 0.25→0.45)
- **2 Rows**: Orange line (Naming: 0.25→0.6, Decomp: 0.4→0.75)
- **3 Rows**: Teal line (Naming: 0.25→0.7, Decomp: 0.45→0.85)
---
### Detailed Analysis
#### Left Graph (Naming Accuracy)
- **Human**: Flat green dashed line at ~0.85.
- **Rel-AIR**: Flat purple dotted line at ~0.9.
- **CoPINet + ACL**: Flat blue dotted line at ~0.95.
- **Random**: Flat black dotted line at ~0.5.
- **1 Row**: Starts at 0.2 (10⁻¹) and rises to 0.35 (10²).
- **2 Rows**: Starts at 0.25 (10⁻¹) and rises to 0.6 (10²).
- **3 Rows**: Starts at 0.25 (10⁻¹) and rises to 0.7 (10²).
#### Right Graph (Decomposition Accuracy)
- **Human**: Flat green dashed line at ~0.85.
- **Rel-AIR**: Flat purple dotted line at ~0.9.
- **CoPINet + ACL**: Flat blue dotted line at ~0.95.
- **Random**: Flat black dotted line at ~0.5.
- **1 Row**: Starts at 0.25 (10⁻¹) and rises to 0.45 (10²).
- **2 Rows**: Starts at 0.4 (10⁻¹) and rises to 0.75 (10²).
- **3 Rows**: Starts at 0.45 (10⁻¹) and rises to 0.85 (10²).
---
### Key Observations
1. **Human Performance**: Both graphs show human accuracy (~0.85) as a consistent baseline.
2. **Model Performance**:
- **CoPINet + ACL** outperforms all other models, approaching human-level accuracy.
- **Rel-AIR** performs slightly better than human in Naming Accuracy (~0.9 vs. 0.85).
3. **Row Configurations**:
- Increasing rows improves accuracy: 1 Row < 2 Rows < 3 Rows.
- 3 Rows achieves ~0.85 Decomposition Accuracy (matching human) at 10² parameters.
4. **Random Baseline**: Both graphs show random chance at ~0.5, serving as a lower bound.
---
### Interpretation
- **Model Size Impact**: Larger models (10² parameters) consistently outperform smaller ones, suggesting scalability benefits.
- **Architectural Design**: The "Rows" configuration directly correlates with accuracy gains, indicating that deeper or more complex architectures improve performance.
- **CoPINet + ACL Superiority**: This model configuration closes the gap to human performance, highlighting its effectiveness in leveraging model capacity.
- **Rel-AIR Anomaly**: Slightly exceeds human Naming Accuracy (~0.9 vs. 0.85), possibly due to overfitting or specialized training.
- **Practical Implications**: Optimizing row configurations and model size can bridge the gap between AI and human performance in accuracy-critical tasks.
---
### Spatial Grounding & Validation
- **Legend Placement**: Right-aligned, with clear color-coded labels.
- **Line Consistency**: Colors match legend entries (e.g., teal = 3 Rows).
- **Trend Verification**: All lines slope upward with increasing model size, confirming the stated trends.