## Chart: Performance Comparison of Goedel-Prover-SFT and Kimina-Prover-Preview-Distill-7B
### Overview
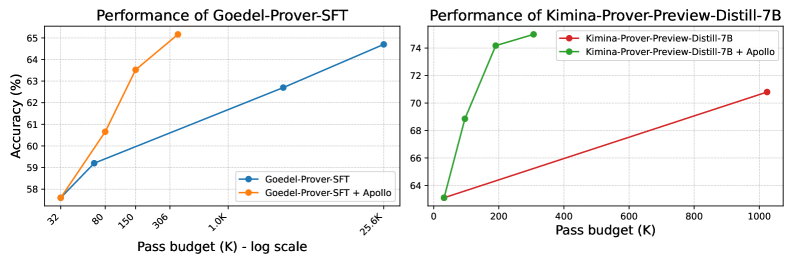
The image presents two line charts comparing the performance of different models based on "Pass budget (K)" and "Accuracy (%)". The left chart focuses on "Goedel-Prover-SFT" with and without "Apollo", while the right chart focuses on "Kimina-Prover-Preview-Distill-7B" with and without "Apollo".
### Components/Axes
**Left Chart:**
* **Title:** Performance of Goedel-Prover-SFT
* **X-axis:** Pass budget (K) - log scale
* Scale markers: 32, 80, 150, 306, 1.0K, 25.6K
* **Y-axis:** Accuracy (%)
* Scale markers: 58, 59, 60, 61, 62, 63, 64, 65
* **Legend:** Located in the bottom-right corner.
* Blue line: Goedel-Prover-SFT
* Orange line: Goedel-Prover-SFT + Apollo
**Right Chart:**
* **Title:** Performance of Kimina-Prover-Preview-Distill-7B
* **X-axis:** Pass budget (K)
* Scale markers: 0, 200, 400, 600, 800, 1000
* **Y-axis:** Accuracy (%)
* Scale markers: 64, 66, 68, 70, 72, 74
* **Legend:** Located in the top-right corner.
* Red line: Kimina-Prover-Preview-Distill-7B
* Green line: Kimina-Prover-Preview-Distill-7B + Apollo
### Detailed Analysis
**Left Chart (Goedel-Prover-SFT):**
* **Goedel-Prover-SFT (Blue):** The line slopes upward, indicating increasing accuracy with a larger pass budget.
* (32, 57.7%)
* (80, 59.2%)
* (150, 60.5%)
* (306, 61.3%)
* (1.0K, 62.2%)
* (25.6K, 64.7%)
* **Goedel-Prover-SFT + Apollo (Orange):** The line slopes upward, indicating increasing accuracy with a larger pass budget.
* (32, 57.6%)
* (80, 60.7%)
* (150, 63.5%)
* (306, 65.1%)
**Right Chart (Kimina-Prover-Preview-Distill-7B):**
* **Kimina-Prover-Preview-Distill-7B (Red):** The line slopes upward, indicating increasing accuracy with a larger pass budget.
* (0, 63.2%)
* (1000, 71.0%)
* **Kimina-Prover-Preview-Distill-7B + Apollo (Green):** The line slopes upward, indicating increasing accuracy with a larger pass budget.
* (0, 63.1%)
* (100, 68.8%)
* (200, 74.1%)
* (300, 74.8%)
### Key Observations
* In the Goedel-Prover-SFT chart, the "Apollo" addition consistently improves accuracy across all pass budget values.
* The x-axis on the left chart is logarithmic, while the x-axis on the right chart is linear.
* In the Kimina-Prover-Preview-Distill-7B chart, the "Apollo" addition significantly improves accuracy, especially at lower pass budget values. The green line plateaus after 200K.
### Interpretation
The charts compare the performance of two different models, "Goedel-Prover-SFT" and "Kimina-Prover-Preview-Distill-7B", with and without the addition of "Apollo". The data suggests that adding "Apollo" generally improves the accuracy of both models. However, the impact of "Apollo" is more pronounced for "Kimina-Prover-Preview-Distill-7B", especially at lower pass budget values. The logarithmic scale on the left chart indicates that the pass budget has a diminishing return on accuracy for "Goedel-Prover-SFT". The Kimina model with Apollo plateaus quickly, suggesting a saturation point.