**Language Declaration:** The text in this image is entirely in English. No other languages are present.
## Line Charts: Performance Impact of "Apollo" on Prover Models
### Overview
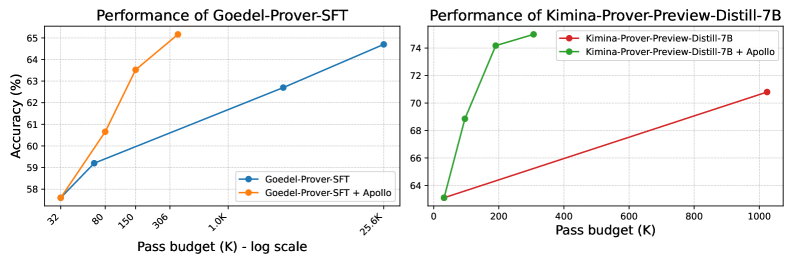
The image consists of two side-by-side line charts comparing the performance (Accuracy) against computational cost (Pass budget) for two different AI models: "Goedel-Prover-SFT" (left) and "Kimina-Prover-Preview-Distill-7B" (right). Both charts demonstrate the baseline model's performance compared to the model augmented with a system or method called "Apollo".
### Component Isolation: Left Chart (Goedel-Prover-SFT)
#### Components/Axes
* **Positioning:** Left half of the image.
* **Title:** "Performance of Goedel-Prover-SFT" (Top center).
* **Y-axis:** Labeled "Accuracy (%)". Linear scale with major gridlines at 58, 59, 60, 61, 62, 63, 64, and 65.
* **X-axis:** Labeled "Pass budget (K) - log scale". The tick marks are angled and spaced logarithmically. The explicit labels are: 32, 80, 150, 306, 1.0K, 25.6K.
* **Legend:** Located in the bottom-right corner of the chart area.
* Blue line with circular markers: `Goedel-Prover-SFT`
* Orange line with circular markers: `Goedel-Prover-SFT + Apollo`
#### Detailed Analysis
* **Trend Verification (Blue Line - Baseline):** The blue line slopes upward gradually across a massive span of the x-axis (from 32 to 25.6K).
* Point 1: x = 32, y ≈ 57.6%
* Point 2: x = 80, y ≈ 59.2%
* Point 3: x = 1.0K, y ≈ 62.7%
* Point 4: x = 25.6K, y ≈ 64.7%
* **Trend Verification (Orange Line - With Apollo):** The orange line slopes upward steeply, achieving higher accuracy at much lower pass budgets, terminating early on the x-axis.
* Point 1: x = 32, y ≈ 57.6% (Shares exact starting point with baseline)
* Point 2: x = 80, y ≈ 60.7%
* Point 3: x = 150, y ≈ 63.5%
* Point 4: x = 306, y ≈ 65.1%
---
### Component Isolation: Right Chart (Kimina-Prover-Preview-Distill-7B)
#### Components/Axes
* **Positioning:** Right half of the image.
* **Title:** "Performance of Kimina-Prover-Preview-Distill-7B" (Top center).
* **Y-axis:** No explicit text label, but visually shares the "Accuracy (%)" metric from the left chart. Linear scale with major gridlines at 64, 66, 68, 70, 72, and 74.
* **X-axis:** Labeled "Pass budget (K)". This is a **linear scale**, unlike the left chart. Major tick marks at 0, 200, 400, 600, 800, 1000.
* **Legend:** Located in the top-right corner of the chart area.
* Red line with circular markers: `Kimina-Prover-Preview-Distill-7B`
* Green line with circular markers: `Kimina-Prover-Preview-Distill-7B + Apollo`
#### Detailed Analysis
* **Trend Verification (Red Line - Baseline):** The red line slopes upward gradually in a nearly straight line across the linear x-axis.
* Point 1: x ≈ 32 (slightly right of 0), y ≈ 63.1%
* Point 2: x ≈ 1024 (slightly past 1000), y ≈ 70.8%
* **Trend Verification (Green Line - With Apollo):** The green line slopes upward very steeply, then begins to curve (concave down), showing rapid accuracy gains at low pass budgets.
* Point 1: x ≈ 32, y ≈ 63.1% (Shares exact starting point with baseline)
* Point 2: x ≈ 100, y ≈ 68.8%
* Point 3: x ≈ 200, y ≈ 74.1%
* Point 4: x ≈ 300, y ≈ 75.0%
---
### Key Observations
1. **Shared Origins:** In both charts, the baseline model and the Apollo-enhanced model start at the exact same accuracy for the lowest pass budget (approx. 32K).
2. **Drastic Efficiency Gains:** The addition of "Apollo" creates a significantly steeper learning/performance curve in both models.
3. **Scale Discrepancy:** The left chart uses a logarithmic scale for the X-axis to show the baseline model requiring up to 25.6K pass budget to reach ~64.7% accuracy. The Apollo version reaches higher accuracy (~65.1%) at a mere 306 pass budget. This is an efficiency gain of nearly two orders of magnitude.
4. **Higher Baseline:** The Kimina model (right) starts at a higher baseline accuracy (~63%) compared to the Goedel model (~57.6%).
### Interpretation
The data overwhelmingly demonstrates that the "Apollo" method/system acts as a massive multiplier for computational efficiency (measured here as "Pass budget").
By reading between the lines, "Pass budget" likely refers to the number of attempts, samples, or tokens a theorem-proving model is allowed to generate or evaluate to find a correct solution.
Without Apollo, scaling up the pass budget yields diminishing, slow returns (requiring logarithmic scaling on the left chart just to fit the baseline line). With Apollo, the models achieve superior accuracy using a fraction of the computational budget. For example, on the left chart, Apollo achieves in ~300 passes what the baseline cannot achieve in 25,000 passes. On the right chart, Apollo achieves 75% accuracy at 300 passes, while the baseline only reaches ~71% at over 1000 passes. Apollo appears to be a highly effective search heuristic, filtering mechanism, or reasoning enhancement that prevents the models from wasting computational budget on dead ends.