## Line Charts: Performance Comparison of Two AI Models with and without "Apollo" Enhancement
### Overview
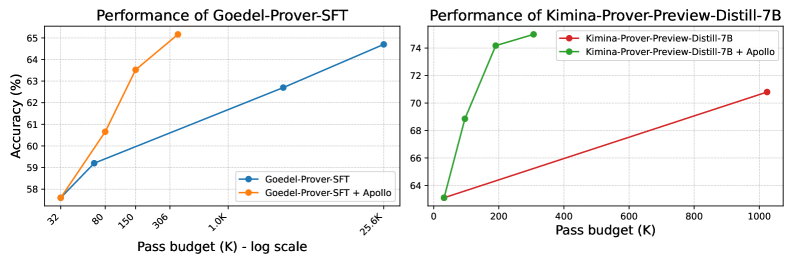
The image displays two side-by-side line charts comparing the performance (accuracy) of two different AI models against an increasing "Pass budget." Each chart compares a base model against the same model enhanced with a component called "Apollo." The left chart uses a logarithmic scale for the x-axis, while the right chart uses a linear scale.
### Components/Axes
**Common Elements:**
* **Y-axis (Both Charts):** Labeled "Accuracy (%)". The scale is linear.
* **X-axis (Both Charts):** Labeled "Pass budget (K)". The unit "K" likely denotes thousands.
* **Left Chart:** Uses a **log scale**. Major tick marks are at 32, 80, 150, 306, 1.0K, and 21.6K.
* **Right Chart:** Uses a **linear scale**. Major tick marks are at 0, 200, 400, 600, 800, and 1000.
* **Legends:** Each chart has a legend identifying the two data series by color and model name.
**Left Chart Specifics:**
* **Title:** "Performance of Goedel-Prover-SFT"
* **Legend (Located inside the plot area, bottom-right):**
* Blue line with circle markers: "Goedel-Prover-SFT"
* Orange line with circle markers: "Goedel-Prover-SFT + Apollo"
**Right Chart Specifics:**
* **Title:** "Performance of Kimina-Prover-Preview-Distill-7B"
* **Legend (Located outside the plot area, top-right):**
* Red line with circle markers: "Kimina-Prover-Preview-Distill-7B"
* Green line with circle markers: "Kimina-Prover-Preview-Distill-7B + Apollo"
### Detailed Analysis
**Left Chart: Goedel-Prover-SFT (Log Scale X-Axis)**
* **Trend Verification:** Both lines show a positive, upward trend as the pass budget increases. The orange line ("+ Apollo") has a steeper initial slope than the blue line.
* **Data Points (Approximate):**
* **Goedel-Prover-SFT (Blue):**
* At 32K: ~57.5%
* At 80K: ~59.3%
* At 1.0K: ~62.7%
* At 21.6K: ~64.5%
* **Goedel-Prover-SFT + Apollo (Orange):**
* At 32K: ~57.5% (same starting point as blue)
* At 80K: ~60.7%
* At 150K: ~63.5%
* At 306K: ~65.0% (final data point for this series)
**Right Chart: Kimina-Prover-Preview-Distill-7B (Linear Scale X-Axis)**
* **Trend Verification:** Both lines show a positive trend. The green line ("+ Apollo") exhibits a very sharp, near-vertical increase at low pass budgets before plateauing. The red line shows a more gradual, steady increase.
* **Data Points (Approximate):**
* **Kimina-Prover-Preview-Distill-7B (Red):**
* At 0K: ~63.0%
* At 1000K: ~70.8%
* **Kimina-Prover-Preview-Distill-7B + Apollo (Green):**
* At 0K: ~63.0% (same starting point as red)
* At ~100K: ~68.8%
* At 200K: ~74.0%
* At 400K: ~75.0% (final data point for this series)
### Key Observations
1. **Apollo's Impact:** In both models, the "+ Apollo" variant significantly outperforms the base model at every measured pass budget beyond the starting point.
2. **Efficiency Gain:** The Apollo enhancement provides a much larger accuracy boost at **lower pass budgets**. This is especially dramatic in the right chart, where the green line reaches near-peak performance (~74%) at just 200K, while the base red line requires 1000K to reach only ~71%.
3. **Performance Ceiling:** The Kimina model with Apollo (green line) appears to hit a performance plateau around 75% accuracy after 400K, suggesting diminishing returns. The Goedel model with Apollo (orange line) does not show a clear plateau within its plotted range.
4. **Scale Context:** The left chart's log scale compresses the high end of the x-axis, making the performance gains of the Goedel model appear more linear. The right chart's linear scale clearly shows the rapid saturation of the Kimina+Apollo model.
### Interpretation
This data demonstrates that the "Apollo" component is a highly effective enhancement for increasing the accuracy of these AI models, particularly in **low-compute or early-budget scenarios**. The primary benefit appears to be a dramatic improvement in **sample efficiency**—achieving high accuracy with a much smaller "pass budget."
The difference in curve shapes between the two models suggests that Apollo's integration or effect may be architecture-dependent. The Kimina model (right) benefits from an extremely rapid initial gain, making it suitable for applications where the computational budget is severely constrained. The Goedel model (left) shows a more sustained, gradual improvement, which might be preferable in scenarios where scaling the budget further is possible and continued gains are valuable.
The charts effectively argue that adding Apollo is not just a minor improvement but a fundamental shift in the performance-vs-budget curve, allowing these models to reach usable accuracy levels far sooner. The choice between the base and Apollo-enhanced versions would depend on the specific operational constraints (available compute/budget) and required accuracy thresholds.