## Diagram: Penguin Population Representation
### Overview
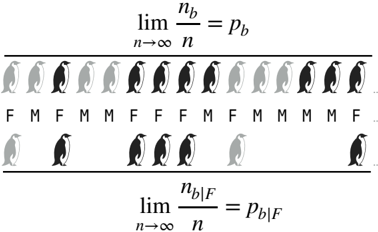
The image is a diagram illustrating a concept related to population statistics, specifically focusing on the proportion of black penguins within a larger penguin population and within a subset of female penguins. The diagram uses penguin illustrations to represent the population and mathematical notation to express the proportions.
### Components/Axes
* **Penguin Illustrations:** Penguins are used to represent individuals in the population. Black penguins represent a specific characteristic (presumably being black), while gray penguins represent the absence of that characteristic.
* **Labels (F, M):** The letters "F" and "M" are placed below some of the penguins, likely representing female and male penguins, respectively.
* **Mathematical Notation (Top):** The expression "lim (n\_b / n) = p\_b" is present, where:
* "lim" denotes the limit as n approaches infinity.
* "n\_b" represents the number of black penguins.
* "n" represents the total number of penguins.
* "p\_b" represents the proportion of black penguins in the overall population.
* **Mathematical Notation (Bottom):** The expression "lim (n\_{b|F} / n) = p\_{b|F}" is present, where:
* "lim" denotes the limit as n approaches infinity.
* "n\_{b|F}" represents the number of black penguins that are female.
* "n" represents the total number of penguins.
* "p\_{b|F}" represents the proportion of black penguins among the female penguins.
### Detailed Analysis
* **Top Row of Penguins:** The top row shows a sequence of penguins, alternating between gray and black, with some variation. The sequence is labeled with "F" or "M" below each penguin. The sequence appears to continue indefinitely, indicated by the ellipsis (...).
* **Bottom Row of Penguins:** The bottom row shows a smaller sample of penguins, also labeled with "F" or "M". This row seems to represent a subset of the population, specifically focusing on the female penguins.
* **Proportions:** The mathematical expressions indicate that the diagram is illustrating the concept of proportions within a population and within a subset of that population. The top expression calculates the overall proportion of black penguins, while the bottom expression calculates the proportion of black penguins specifically among the female penguins.
### Key Observations
* The diagram uses visual representation (penguins) to illustrate a statistical concept.
* The mathematical notation provides a formal definition of the proportions being represented.
* The use of "F" and "M" labels suggests that gender is a relevant factor in the analysis.
### Interpretation
The diagram is designed to visually explain the concept of conditional probability or proportions within a population. It demonstrates how the proportion of a certain characteristic (being black) can differ between the overall population and a specific subset of that population (female penguins). The mathematical notation formalizes this concept, showing how the proportions are calculated as the population size approaches infinity. The diagram is likely intended for educational purposes, to help visualize and understand statistical concepts.