\n
## Diagram: Probability Illustration with Penguins
### Overview
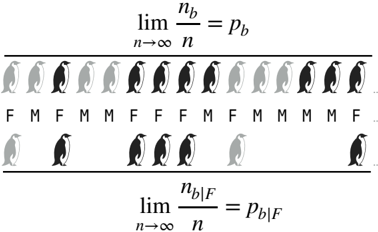
The image is a diagram illustrating the concept of probability, specifically the law of large numbers, using a sequence of penguin images. Penguins are depicted in three shades: black, grey, and white. Below the penguin sequence are labels indicating "F" and "M" for each penguin, presumably representing female and male. Mathematical formulas are presented above and below the penguin sequences.
### Components/Axes
The diagram consists of the following components:
* **Penguin Sequence:** A horizontal row of 15 penguins, alternating in shades and labeled with "F" or "M".
* **Mathematical Formula (Top):** `lim (n→∞) n_b / n = p_b`
* **Mathematical Formula (Bottom):** `lim (n→∞) n_b|F / n = p_b|F`
* **Labels:** "F" and "M" are used to label each penguin.
* **Penguin Shades:** Black, grey, and white penguins are used.
### Detailed Analysis or Content Details
The penguin sequence is as follows, with shade and label:
1. Grey, F
2. Black, M
3. Grey, F
4. Black, M
5. Grey, F
6. Black, F
7. Grey, F
8. Black, F
9. Grey, M
10. Black, F
11. Grey, M
12. Black, M
13. Grey, M
14. Black, M
15. Grey, F
The top formula states: "The limit as n approaches infinity of n_b divided by n equals p_b".
The bottom formula states: "The limit as n approaches infinity of n_b|F divided by n equals p_b|F".
* `n_b` likely represents the number of black penguins.
* `n` represents the total number of penguins.
* `p_b` likely represents the probability of a penguin being black.
* `n_b|F` likely represents the number of black penguins given that they are female.
* `p_b|F` likely represents the probability of a penguin being black given that it is female.
In the sequence of 15 penguins, there are 8 black penguins, 5 grey penguins, and 2 white penguins. There are 7 "F" labels and 8 "M" labels. Of the 7 "F" labeled penguins, 3 are black, 3 are grey, and 1 is white. Of the 8 "M" labeled penguins, 5 are black, 2 are grey, and 1 is white.
### Key Observations
The diagram visually represents the concept of approaching a probability as the sample size (n) increases. The formulas suggest that the proportion of black penguins in a large sample will converge to a certain probability (p_b). The bottom formula extends this concept to conditional probability, looking at the proportion of black penguins *given* that they are female. The sequence of penguins is not random, but rather appears to be constructed to illustrate the concept.
### Interpretation
The diagram is a pedagogical tool to explain the law of large numbers and conditional probability. It demonstrates how, as the number of observations increases, the observed frequency of an event (a penguin being black) approaches the theoretical probability of that event. The use of penguins and "F/M" labels makes the abstract mathematical concepts more concrete and relatable. The diagram suggests that the probability of a penguin being black might be different for females versus males, as represented by the conditional probability formula. The diagram does not provide actual data, but rather illustrates the mathematical principles behind probability. The arrangement of the penguins is not random, and is designed to demonstrate the concept.