## Diagram: Probabilistic Penguin Population Model
### Overview
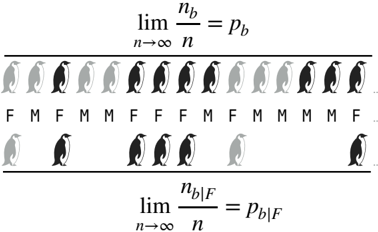
The image depicts a two-row diagram of penguins with labels "F" (likely female) and "M" (likely male) beneath them. Gray penguins represent unobserved or non-black individuals, while black penguins represent observed/black individuals. Two mathematical limits are shown: one for the overall proportion of black penguins and another for the conditional proportion of black penguins given "F".
### Components/Axes
- **Top Row**:
- Sequence of 15 penguins (gray and black) with alternating "F" and "M" labels.
- Mathematical expression:
`lim (n→∞) nb/n = pb`
(Proportion of black penguins converges to `pb` as sample size grows)
- **Bottom Row**:
- Sequence of 10 penguins (gray and black) with clustered "F" and "M" labels.
- Mathematical expression:
`lim (n→∞) nb|F/n = pb|F`
(Conditional proportion of black penguins given "F" converges to `pb|F`)
### Detailed Analysis
1. **Top Row**:
- 7 black penguins (nb = 7) out of 15 total (n = 15).
- Proportion: 7/15 ≈ 0.467 (≈46.7%).
- Labels alternate "F" and "M" with no clear pattern in penguin color.
- Gray penguins appear randomly distributed.
2. **Bottom Row**:
- 4 black penguins (nb|F = 4) out of 10 total (n = 10).
- Proportion: 4/10 = 0.4 (40%).
- Labels cluster as "F F F M M M M F" with penguin colors grouped:
- First 3 "F" labels correspond to 2 black penguins.
- Next 4 "M" labels correspond to 2 black penguins.
- Final "F" label corresponds to 1 black penguin.
### Key Observations
- The top row shows a more uniform distribution of black penguins across "F" and "M" labels.
- The bottom row exhibits clustering of black penguins within specific label groups ("F" and "M").
- The mathematical limits suggest probabilistic convergence:
- `pb` ≈ 0.467 (top row) vs. `pb|F` ≈ 0.4 (bottom row).
- Conditional probability `pb|F` is lower than the unconditional `pb`.
### Interpretation
This diagram illustrates the **law of large numbers** and **conditional probability** using a penguin metaphor:
1. **Unconditional Probability (`pb`)**: The overall proportion of black penguins stabilizes at ~46.7% as the population grows, regardless of gender.
2. **Conditional Probability (`pb|F`)**: When restricting to "F" labels, the proportion of black penguins decreases to 40%, indicating a potential gender-specific trait or observational bias.
3. **Clustering in Bottom Row**: The grouped "F" and "M" labels with concentrated black penguins may represent:
- Subpopulation stratification (e.g., different habitats for "F" vs. "M").
- Measurement error or sampling bias in conditional observations.
4. **Gray Penguins**: Represent unobserved or non-black individuals, emphasizing the distinction between total population (`n`) and observed subset (`nb`).
The model highlights how conditional probabilities (`pb|F`) can differ from marginal probabilities (`pb`), a critical concept in statistical inference and hypothesis testing.