## Histogram: Length of Reasoning Chains in Tokens, Comparative Illusion vs. Control
### Overview
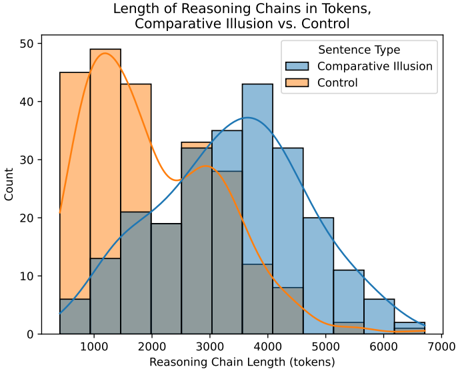
The image is a histogram comparing the distribution of reasoning chain lengths (in tokens) for two sentence types: "Comparative Illusion" and "Control". The histogram displays the frequency (count) of different reasoning chain lengths, with overlaid curves representing the estimated probability density for each sentence type.
### Components/Axes
* **Title:** Length of Reasoning Chains in Tokens, Comparative Illusion vs. Control
* **X-axis:** Reasoning Chain Length (tokens)
* Scale: 0 to 7000, with tick marks at 1000, 2000, 3000, 4000, 5000, 6000, and 7000.
* **Y-axis:** Count
* Scale: 0 to 50, with tick marks at 0, 10, 20, 30, 40, and 50.
* **Legend:** Located in the top-right corner.
* "Comparative Illusion": Represented by light blue bars and a blue curve.
* "Control": Represented by light orange bars and an orange curve.
### Detailed Analysis
The histogram shows the distribution of reasoning chain lengths for both "Comparative Illusion" and "Control" sentence types.
* **Comparative Illusion (Light Blue):**
* The distribution is centered around 4000 tokens.
* The count for the 1000 token bin is approximately 13.
* The count for the 2000 token bin is approximately 21.
* The count for the 3000 token bin is approximately 33.
* The count for the 4000 token bin is approximately 43.
* The count for the 5000 token bin is approximately 30.
* The count for the 6000 token bin is approximately 6.
* The blue curve shows a unimodal distribution, peaking around 4000 tokens.
* **Control (Light Orange):**
* The distribution is centered around 1000 tokens.
* The count for the 1000 token bin is approximately 48.
* The count for the 2000 token bin is approximately 43.
* The count for the 3000 token bin is approximately 33.
* The count for the 4000 token bin is approximately 12.
* The count for the 5000 token bin is approximately 2.
* The count for the 6000 token bin is approximately 1.
* The orange curve shows a unimodal distribution, peaking around 1000 tokens.
### Key Observations
* The "Control" sentence type has a much shorter reasoning chain length compared to the "Comparative Illusion" sentence type.
* The "Control" distribution is heavily skewed towards shorter chain lengths, with a peak around 1000 tokens.
* The "Comparative Illusion" distribution is more spread out, with a peak around 4000 tokens.
* There is some overlap between the two distributions in the 2000-3000 token range.
### Interpretation
The data suggests that "Comparative Illusion" sentences require longer reasoning chains than "Control" sentences. This could indicate that understanding or processing "Comparative Illusion" sentences involves more complex cognitive processes or requires the consideration of more information. The difference in distribution shapes further supports this, with "Comparative Illusion" showing a broader range of reasoning chain lengths, possibly reflecting varying levels of complexity in processing these types of sentences. The "Control" sentences, on the other hand, appear to be processed with relatively shorter and more consistent reasoning chains.