## Histogram: Length of Reasoning Chains in Tokens, Comparative Illusion vs. Control
### Overview
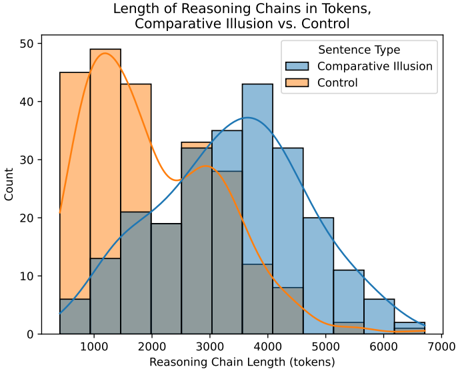
The image is a comparative histogram showing the distribution of reasoning chain lengths (in tokens) for two groups: "Comparative Illusion" (blue) and "Control" (orange). Overlaid on the histograms are kernel density estimation (KDE) curves, which smooth the distributions. The x-axis represents reasoning chain length (tokens), and the y-axis represents count. The Control group’s data is concentrated at shorter chain lengths, while the Comparative Illusion group’s data spans longer chain lengths with greater variability.
### Components/Axes
- **Title**: "Length of Reasoning Chains in Tokens, Comparative Illusion vs. Control"
- **X-axis**: "Reasoning Chain Length (tokens)" (range: 0–7000)
- **Y-axis**: "Count" (range: 0–50)
- **Legend**:
- Blue: Comparative Illusion
- Orange: Control
- **Placement**:
- Legend: Top-right corner
- Histograms: Side-by-side (orange on the left, blue on the right)
- KDE curves: Overlaid on respective histograms
### Detailed Analysis
- **Control Group (Orange)**:
- Histogram peaks sharply at **1000–2000 tokens**, with a KDE curve showing a narrow, high-density peak.
- Counts drop rapidly beyond 2000 tokens, with minimal presence above 3000 tokens.
- Example: ~45 counts at 1000 tokens, ~30 counts at 2000 tokens, and near-zero counts above 5000 tokens.
- **Comparative Illusion Group (Blue)**:
- Histogram peaks at **3000–4000 tokens**, with a broader, flatter distribution.
- KDE curve shows a wider spread, with counts extending up to ~6000 tokens.
- Example: ~35 counts at 3000 tokens, ~25 counts at 4000 tokens, and ~5 counts at 6000 tokens.
### Key Observations
1. **Control Group**: Dominated by short reasoning chains (1000–2000 tokens), suggesting simpler or more direct reasoning processes.
2. **Comparative Illusion Group**: Longer and more variable reasoning chains (3000–6000 tokens), indicating increased complexity or uncertainty in reasoning.
3. **KDE Curves**: Confirm the Control group’s narrow distribution vs. the Comparative Illusion group’s broader spread.
4. **Outliers**: No extreme outliers in either group, but the Comparative Illusion group shows a tail extending to ~6000 tokens.
### Interpretation
The data suggests that **Comparative Illusion** introduces cognitive complexity, leading to longer reasoning chains compared to the Control group. The Control group’s shorter chains may reflect more straightforward decision-making, while the Comparative Illusion group’s variability could stem from conflicting information or heightened uncertainty. The KDE curves reinforce these trends, highlighting the Control group’s efficiency and the Comparative Illusion group’s resource-intensive processing. This aligns with theories that illusory comparisons require deeper cognitive engagement to resolve ambiguities.