## Line Chart: Spectral-Guided Layer Pruning: Comparison of Strategies
### Overview
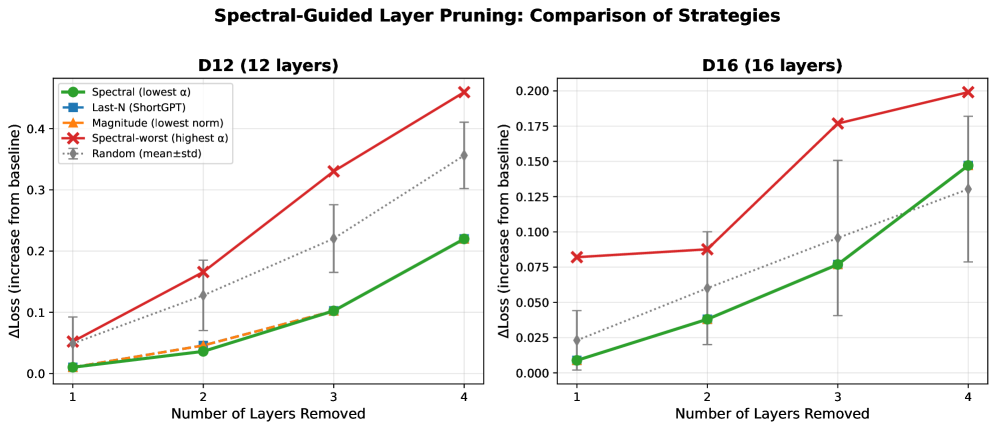
The image compares four layer pruning strategies (Spectral, Last-N, Magnitude, Spectral-worst) and a random baseline across two neural network architectures (D12 with 12 layers and D16 with 16 layers). The y-axis measures the relative increase in loss (ΔLoss) from the baseline, while the x-axis tracks the number of layers removed (1–4). Error bars represent standard deviation.
### Components/Axes
- **Title**: "Spectral-Guided Layer Pruning: Comparison of Strategies"
- **Subplots**:
- Left: D12 (12 layers)
- Right: D16 (16 layers)
- **X-axis**: "Number of Layers Removed" (1–4)
- **Y-axis**: "ΔLoss (increase from baseline)" (0–0.4 for D12, 0–0.2 for D16)
- **Legend** (top-left):
- Spectral (lowest α): Green circles
- Last-N (ShortGPT): Blue squares
- Magnitude (lowest norm): Orange triangles
- Spectral-worst (highest α): Red crosses
- Random (mean±std): Gray diamonds
### Detailed Analysis
#### D12 Subplot (12 layers)
- **Spectral-worst (red crosses)**:
- Starts at ~0.05 (1 layer removed), peaks at ~0.45 (4 layers removed).
- Steep upward trend with error bars increasing from ±0.02 to ±0.04.
- **Spectral (green circles)**:
- Starts near 0, rises to ~0.22 (4 layers removed).
- Error bars: ±0.01 to ±0.03.
- **Last-N (blue squares)**:
- Similar to Spectral but slightly lower (e.g., ~0.18 at 4 layers).
- Error bars: ±0.02 to ±0.04.
- **Magnitude (orange triangles)**:
- Flat line (~0.02–0.03 across all layers).
- Minimal error bars (±0.01).
- **Random (gray diamonds)**:
- Starts at ~0.05, rises to ~0.35 (4 layers removed).
- Error bars: ±0.03 to ±0.05.
#### D16 Subplot (16 layers)
- **Spectral-worst (red crosses)**:
- Starts at ~0.075 (1 layer), peaks at ~0.20 (4 layers).
- Error bars: ±0.03 to ±0.06.
- **Spectral (green circles)**:
- Starts near 0, rises to ~0.15 (4 layers).
- Error bars: ±0.01 to ±0.02.
- **Last-N (blue squares)**:
- Similar to Spectral (~0.13 at 4 layers).
- Error bars: ±0.02 to ±0.04.
- **Magnitude (orange triangles)**:
- Flat line (~0.02–0.03).
- Minimal error bars (±0.01).
- **Random (gray diamonds)**:
- Starts at ~0.025, rises to ~0.13 (4 layers).
- Error bars: ±0.03 to ±0.05.
### Key Observations
1. **Spectral-worst** consistently causes the largest loss increase in both architectures, with steeper slopes in D12.
2. **Spectral** and **Last-N** perform similarly, with Spectral slightly outperforming Last-N in D12.
3. **Magnitude** pruning has negligible impact on loss across all configurations.
4. **Random** pruning shows moderate loss increases, worse than Spectral/Last-N but better than Spectral-worst.
5. D16 (16 layers) exhibits smaller absolute loss increases than D12 (12 layers) for all strategies.
### Interpretation
The data demonstrates that **Spectral-guided pruning (lowest α)** is the most effective strategy, minimizing loss increases during layer removal. **Spectral-worst pruning** (highest α) is the least effective, causing disproportionately large losses, especially in deeper networks (D12). The **Magnitude** strategy’s flat performance suggests it is ineffective for this task. The **Random** baseline’s performance indicates that unguided pruning introduces moderate but predictable degradation. The smaller loss increases in D16 (16 layers) compared to D12 (12 layers) imply that deeper networks may be more resilient to layer removal under these strategies. Error bars highlight increasing uncertainty with more layers removed, particularly for Spectral-worst and Random strategies.