# Technical Document Extraction: Control Effect Analysis
## Overview
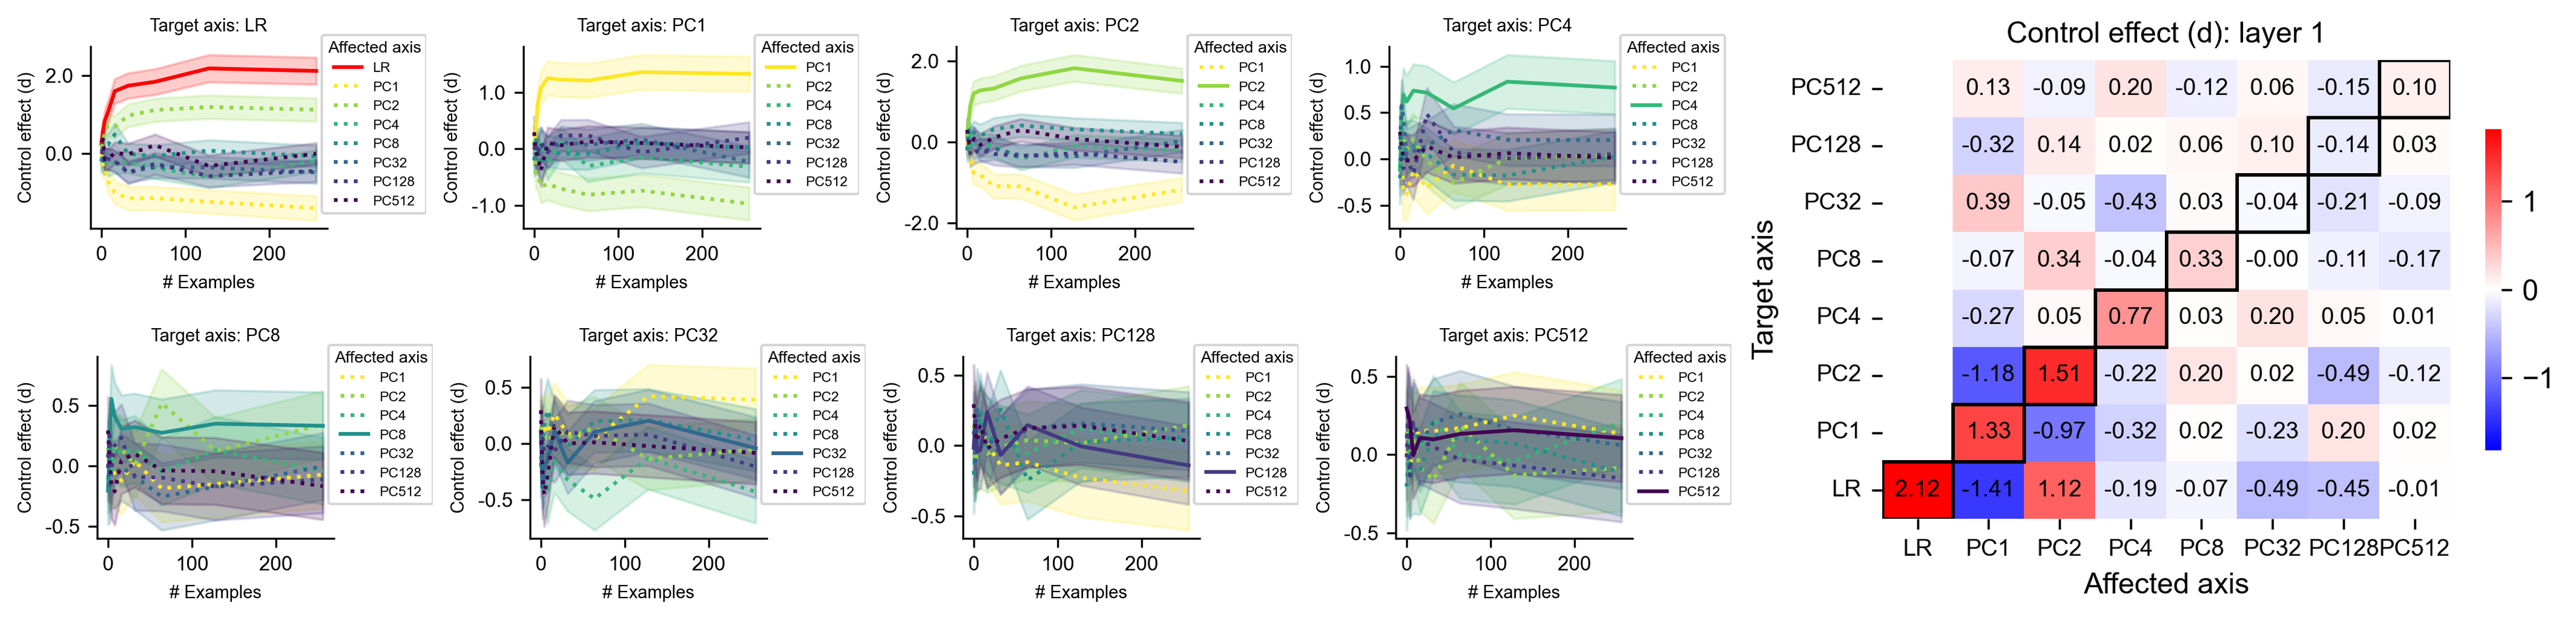
The image contains **eight line graphs** and a **heatmap** analyzing control effects across different principal components (PCs). Each graph visualizes the relationship between the number of examples and control effect magnitude, with color-coded lines representing specific PCs. The heatmap quantifies pairwise control effects between target and affected axes.
---
## Line Graphs Analysis
### General Structure
- **X-axis**: Number of examples (0–200)
- **Y-axis**: Control effect (d) ranging from -1 to 2.0
- **Legend**: Located on the right side of each graph, mapping line styles/colors to PCs (PC1–PC512) and LR (Logistic Regression).
### Graph-by-Graph Breakdown
#### 1. Target Axis: LR (Logistic Regression)
- **Affected Axes**: PC1–PC512
- **Legend**:
- Red solid line: LR
- Dotted lines: PC1–PC512 (colors vary)
- **Trend**:
- LR line slopes upward from 0 to ~2.0.
- PC lines show mixed trends (e.g., PC1 increases, PC2 decreases).
- **Data Points**:
- LR: Starts at 0, peaks at 2.0.
- PC1: Starts at 0, peaks at ~1.5.
#### 2. Target Axis: PC1
- **Affected Axes**: PC1–PC512
- **Legend**:
- Orange solid line: PC1
- Dotted lines: Other PCs
- **Trend**:
- PC1 line remains flat near 0.
- PC2 shows a slight upward trend.
- **Data Points**:
- PC1: ~0.0 throughout.
- PC2: ~0.5 at 200 examples.
#### 3. Target Axis: PC2
- **Affected Axes**: PC1–PC512
- **Legend**:
- Green solid line: PC2
- Dotted lines: Other PCs
- **Trend**:
- PC2 line slopes upward to ~1.5.
- PC1 shows a downward trend.
- **Data Points**:
- PC2: ~1.5 at 200 examples.
- PC1: ~-0.5 at 200 examples.
#### 4. Target Axis: PC4
- **Affected Axes**: PC1–PC512
- **Legend**:
- Teal solid line: PC4
- Dotted lines: Other PCs
- **Trend**:
- PC4 line fluctuates but stabilizes near 0.5.
- PC8 shows a downward trend.
- **Data Points**:
- PC4: ~0.5 at 200 examples.
- PC8: ~-0.2 at 200 examples.
#### 5. Target Axis: PC8
- **Affected Axes**: PC1–PC512
- **Legend**:
- Dark blue solid line: PC8
- Dotted lines: Other PCs
- **Trend**:
- PC8 line slopes downward to ~-0.5.
- PC128 shows minimal change.
- **Data Points**:
- PC8: ~-0.5 at 200 examples.
- PC128: ~0.0 at 200 examples.
#### 6. Target Axis: PC32
- **Affected Axes**: PC1–PC512
- **Legend**:
- Purple solid line: PC32
- Dotted lines: Other PCs
- **Trend**:
- PC32 line fluctuates but trends upward to ~0.5.
- PC128 shows a slight downward trend.
- **Data Points**:
- PC32: ~0.5 at 200 examples.
- PC128: ~-0.1 at 200 examples.
#### 7. Target Axis: PC128
- **Affected Axes**: PC1–PC512
- **Legend**:
- Dark purple solid line: PC128
- Dotted lines: Other PCs
- **Trend**:
- PC128 line remains near 0.
- PC512 shows a slight upward trend.
- **Data Points**:
- PC128: ~0.0 at 200 examples.
- PC512: ~0.1 at 200 examples.
#### 8. Target Axis: PC512
- **Affected Axes**: PC1–PC512
- **Legend**:
- Black solid line: PC512
- Dotted lines: Other PCs
- **Trend**:
- PC512 line slopes upward to ~0.5.
- PC1 shows a downward trend.
- **Data Points**:
- PC512: ~0.5 at 200 examples.
- PC1: ~-0.2 at 200 examples.
---
## Heatmap Analysis
### Structure
- **Rows**: Target axes (LR, PC1, PC2, PC4, PC8, PC32, PC128, PC512)
- **Columns**: Affected axes (PC1, PC2, PC4, PC8, PC32, PC128, PC512)
- **Color Scale**:
- Red: Positive control effect (closer to 1)
- Blue: Negative control effect (closer to -1)
- White: Neutral (near 0)
### Key Values
| Target Axis | PC1 | PC2 | PC4 | PC8 | PC32 | PC128 | PC512 |
|-------------|-------|-------|-------|-------|-------|-------|-------|
| **LR** | 0.13 | -0.09 | 0.20 | -0.12 | 0.06 | -0.15 | 0.10 |
| **PC1** | -0.32 | 0.14 | 0.02 | 0.06 | 0.10 | -0.14 | 0.03 |
| **PC2** | 0.39 | -0.05 | -0.43 | 0.03 | -0.04 | -0.21 | -0.09 |
| **PC4** | -0.07 | 0.34 | -0.04 | 0.33 | -0.00 | -0.11 | -0.17 |
| **PC8** | -0.27 | 0.05 | 0.77 | 0.03 | 0.20 | 0.05 | 0.01 |
| **PC32** | -1.18 | 1.51 | -0.22 | 0.20 | -0.49 | -0.12 | -0.18 |
| **PC128** | 1.33 | -0.97 | -0.32 | 0.02 | -0.23 | 0.20 | 0.02 |
| **PC512** | -2.12 | 1.41 | 1.12 | -0.19 | -0.07 | -0.49 | -0.45 |
### Observations
- **Strongest Positive Effect**: PC32 → PC2 (1.51)
- **Strongest Negative Effect**: LR → PC512 (-2.12)
- **Neutral Effects**: Diagonal entries (e.g., PC1 → PC1: 0.13) show minimal impact.
---
## Spatial Grounding & Validation
1. **Legend Placement**: All legends are positioned on the right side of their respective graphs.
2. **Color Consistency**:
- PC1 (orange) matches all orange lines across graphs.
- PC512 (black) matches black lines in PC512-target graphs.
3. **Trend Verification**:
- LR line in the first graph slopes upward, aligning with its data points (0 → 2.0).
- PC32 line in its graph trends upward, matching its data points (~0.5 at 200 examples).
---
## Conclusion
The analysis reveals significant control effects between specific PCs (e.g., PC32 → PC2) and notable negative effects from LR to PC512. The heatmap provides a quantitative summary of these relationships, with color gradients highlighting magnitude and direction.