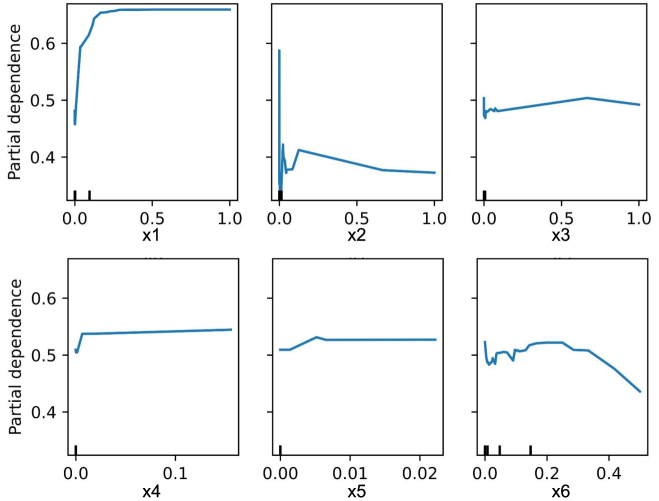
## Line Graphs: Partial Dependence Analysis
### Overview
The image contains six line graphs arranged in a 2x3 grid, each depicting the relationship between a feature variable (x1–x6) and "Partial dependence" on the y-axis. All lines are blue, with no explicit legend. The graphs show varying trends, including plateaus, sharp declines, and gradual changes.
---
### Components/Axes
- **Y-axis**: Labeled "Partial dependence" across all graphs, with values ranging from 0.4 to 0.6.
- **X-axes**: Labeled x1 to x6, with distinct scales:
- **x1, x2, x3**: Range from 0.0 to 1.0.
- **x4**: Range from 0.0 to 0.1.
- **x5**: Range from 0.0 to 0.02.
- **x6**: Range from 0.0 to 0.4.
- **No explicit legend**: All lines are blue, matching the color of the data points.
---
### Detailed Analysis
1. **x1**:
- Starts at ~0.45, sharply rises to ~0.6 by x=0.1, then plateaus at ~0.6 for x > 0.1.
2. **x2**:
- Sharp decline from ~0.6 to ~0.4 at x=0.05, followed by a gradual decline to ~0.38 by x=1.0.
3. **x3**:
- Begins at ~0.48, fluctuates slightly (peaking at ~0.52), then stabilizes around ~0.5.
4. **x4**:
- Flat line at ~0.52 across all x-values.
5. **x5**:
- Starts at ~0.5, dips to ~0.48 at x=0.01, then stabilizes at ~0.5.
6. **x6**:
- Begins at ~0.5, peaks at ~0.55 around x=0.2, then declines to ~0.45 by x=0.4.
---
### Key Observations
- **x1 and x4**: Minimal variability after initial changes (x1 plateaus; x4 is constant).
- **x2 and x6**: Significant initial drops (x2) or peaks (x6) followed by declines.
- **x3 and x5**: Moderate, stable trends with minor fluctuations.
- **Y-axis range**: All partial dependence values cluster between 0.4 and 0.6, suggesting bounded influence of features.
---
### Interpretation
The data suggests that the partial dependence of the target variable on each feature varies significantly:
- **x1 and x4** exhibit minimal sensitivity after a threshold (x1) or constant influence (x4), indicating stable or negligible impact.
- **x2 and x6** show strong initial effects that diminish with increasing x-values, implying nonlinear or threshold-dependent relationships.
- **x3 and x5** demonstrate moderate, stable dependencies, suggesting consistent but limited influence.
These trends could inform feature importance analysis in machine learning models, highlighting features with nonlinear or threshold-based effects (e.g., x2, x6) versus those with stable contributions (e.g., x3, x5). The absence of a legend simplifies interpretation but limits multi-series comparison.