# Technical Document Extraction: UV Slope vs. UV Magnitude Plot
## 1. Axis Labels and Titles
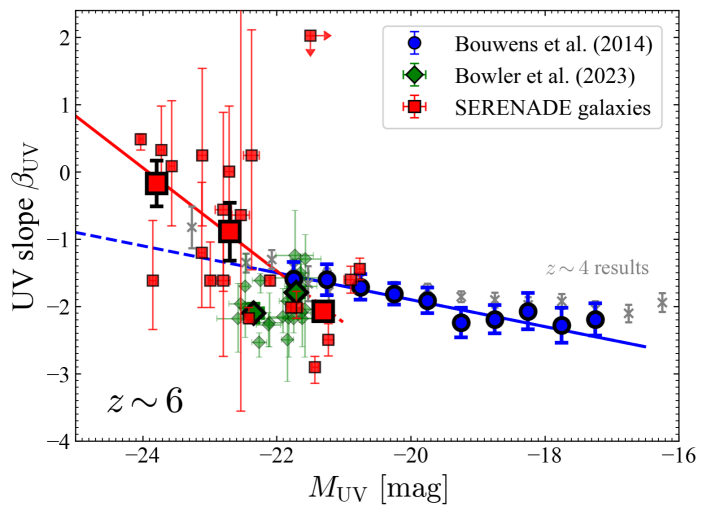
- **X-axis**: `M_UV [mag]` (UV Magnitude in magnitudes)
- **Y-axis**: `UV slope β_UV` (UV spectral slope in arbitrary units)
## 2. Legend and Data Series
- **Legend Placement**: Top-right corner of the plot
- **Data Series**:
- **Blue Circles**: Bouwens et al. (2014) data points
- **Green Diamonds**: Bowler et al. (2023) data points
- **Red Squares**: SERENADE galaxies data points
## 3. Key Trends and Data Points
### SERENADE Galaxies (Red Squares)
- **Visual Trend**: Data points exhibit high scatter, with a general decline in UV slope (β_UV) as UV magnitude (M_UV) increases.
- **Notable Points**:
- One outlier at `M_UV ≈ -24` with `β_UV ≈ 0` (marked with a black "T" symbol).
- Multiple points clustered near `M_UV ≈ -22` with `β_UV ≈ -1` to `-2`.
### Bouwens et al. (2014) (Blue Circles)
- **Visual Trend**: Data points align closely with the **blue dashed line** labeled `z ∼ 4 results`, showing a consistent decline in β_UV with increasing M_UV.
- **Key Range**: Spans `M_UV ≈ -22` to `M_UV ≈ -18`, with β_UV decreasing from ~-1 to ~-3.
### Bowler et al. (2023) (Green Diamonds)
- **Visual Trend**: Data points are more dispersed, with no clear trend. Some overlap with SERENADE galaxies and Bouwens et al. datasets.
- **Key Range**: Covers `M_UV ≈ -24` to `M_UV ≈ -20`, with β_UV ranging from ~-1 to ~1.
## 4. Additional Elements
- **Red Solid Line**: Labeled `z ∼ 6 results`, positioned diagonally from `M_UV ≈ -24` (β_UV ≈ 0) to `M_UV ≈ -18` (β_UV ≈ -2).
- **Blue Dashed Line**: Labeled `z ∼ 4 results`, positioned diagonally from `M_UV ≈ -22` (β_UV ≈ -1) to `M_UV ≈ -18` (β_UV ≈ -3).
## 5. Spatial Grounding and Color Verification
- **Legend Colors**:
- Blue circles match Bouwens et al. (2014) data points.
- Green diamonds match Bowler et al. (2023) data points.
- Red squares match SERENADE galaxies data points.
- **Line Colors**:
- Red solid line corresponds to `z ∼ 6 results`.
- Blue dashed line corresponds to `z ∼ 4 results`.
## 6. Component Isolation
### Header
- No explicit header text; legend serves as the primary reference.
### Main Chart
- **X-axis Range**: -24 to -16 (logarithmic scale implied for UV magnitude).
- **Y-axis Range**: -4 to 2 (linear scale).
- **Data Distribution**:
- SERENADE galaxies (red squares) dominate the left side of the plot (`M_UV < -22`).
- Bouwens et al. (blue circles) and Bowler et al. (green diamonds) overlap in the central region (`M_UV ≈ -22` to `-18`).
### Footer
- No explicit footer text; axis labels and legend provide contextual grounding.
## 7. Data Table Reconstruction
| Data Series | Marker | Color | Key Trend | M_UV Range (mag) | β_UV Range |
|----------------------|---------|--------|------------------------------------|------------------|------------|
| SERENADE galaxies | Square | Red | High scatter, declining trend | -24 to -20 | -1 to 2 |
| Bouwens et al. (2014)| Circle | Blue | Aligns with z ∼ 4 results | -22 to -18 | -1 to -3 |
| Bowler et al. (2023) | Diamond | Green | Dispersed, no clear trend | -24 to -20 | -1 to 1 |
## 8. Critical Observations
- **z ∼ 6 Results (Red Line)**: Represents a theoretical or model-based trend for galaxies at redshift z ≈ 6, showing a steep decline in UV slope with increasing brightness.
- **z ∼ 4 Results (Blue Dashed Line)**: Observational trend for galaxies at z ≈ 4, with a shallower decline in UV slope.
- **Discrepancies**: SERENADE galaxies (red squares) show higher UV slopes (β_UV) compared to other datasets, suggesting potential differences in galaxy populations or measurement methodologies.
## 9. Language and Transcription
- **Primary Language**: English (all labels, titles, and annotations are in English).
- **No Additional Languages Detected**.
## 10. Final Notes
- The plot compares UV slope (β_UV) as a function of UV magnitude (M_UV) for three distinct datasets, with redshift-specific trends highlighted.
- The SERENADE galaxies dataset (red squares) exhibits unique characteristics, warranting further investigation into their UV properties.