# Technical Document Analysis: WebShop Success Rate Chart
## Header
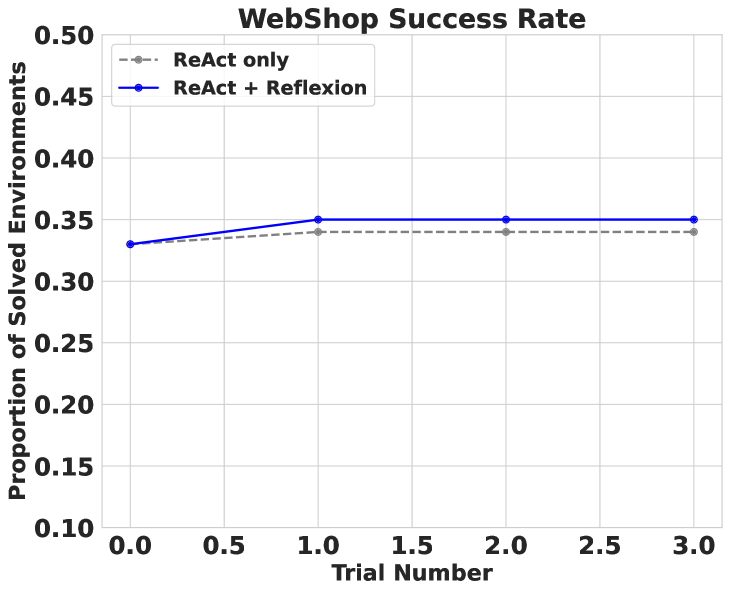
- **Title**: "WebShop Success Rate"
## Main Chart
### Axes
- **X-axis (Horizontal)**:
- **Label**: "Trial Number"
- **Values**: 0.0, 0.5, 1.0, 1.5, 2.0, 2.5, 3.0
- **Y-axis (Vertical)**:
- **Label**: "Proportion of Solved Environments"
- **Values**: 0.10, 0.15, 0.20, 0.25, 0.30, 0.35, 0.40, 0.45, 0.50
### Data Series
1. **ReAct only** (Dashed Gray Line):
- **Trend**:
- Starts at ~0.33 (Trial 0.0)
- Slight upward slope to ~0.34 (Trial 1.0)
- Plateaus at ~0.34 for Trials 2.0 and 3.0
- **Data Points**:
- [0.0, ~0.33]
- [1.0, ~0.34]
- [2.0, ~0.34]
- [3.0, ~0.34]
2. **ReAct + Reflexion** (Solid Blue Line):
- **Trend**:
- Starts at ~0.33 (Trial 0.0)
- Sharp upward slope to ~0.35 (Trial 1.0)
- Remains flat at ~0.35 for Trials 2.0 and 3.0
- **Data Points**:
- [0.0, ~0.33]
- [1.0, ~0.35]
- [2.0, ~0.35]
- [3.0, ~0.35]
### Legend
- **Position**: Top-left corner
- **Entries**:
- **ReAct only**: Dashed gray line
- **ReAct + Reflexion**: Solid blue line
## Spatial Grounding
- **Legend Placement**: Top-left quadrant of the chart
- **Color Consistency**:
- Dashed gray line matches "ReAct only" legend entry
- Solid blue line matches "ReAct + Reflexion" legend entry
## Component Isolation
1. **Header**: Contains only the title "WebShop Success Rate"
2. **Main Chart**:
- Axes with labeled ticks
- Two data series with distinct line styles
3. **Footer**: No explicit footer present
## Trend Verification
- **ReAct only**: Minimal improvement over trials (flat trend after Trial 1.0)
- **ReAct + Reflexion**: Significant early improvement (Trial 0.0 to 1.0), followed by stabilization
## Data Table Reconstruction
No explicit data table is present. Data points are inferred from line positions and axis markers.
## Final Validation
- All axis labels, markers, and legend entries are transcribed.
- Line colors/styles match legend entries.
- Trends align with visual slopes and plateauing behavior.